Figure 2.
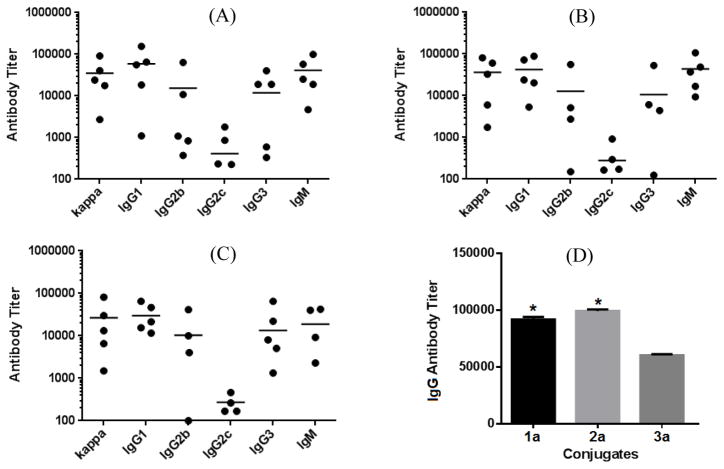
ELISA results of the day 48 antisera of individual mice inoculated with conjugates 1a (A), 2a (B), and 3a (C), with the antibody titer of each mouse shown as a dot and the group average as a black bar, as well as the total IgG antibody titers of the pooled day 48 antisera of each group of mice inoculated with 1a–3a (D). * Titer difference from that of 3a is statistically significant (P < 0.05).

