Figure 5.
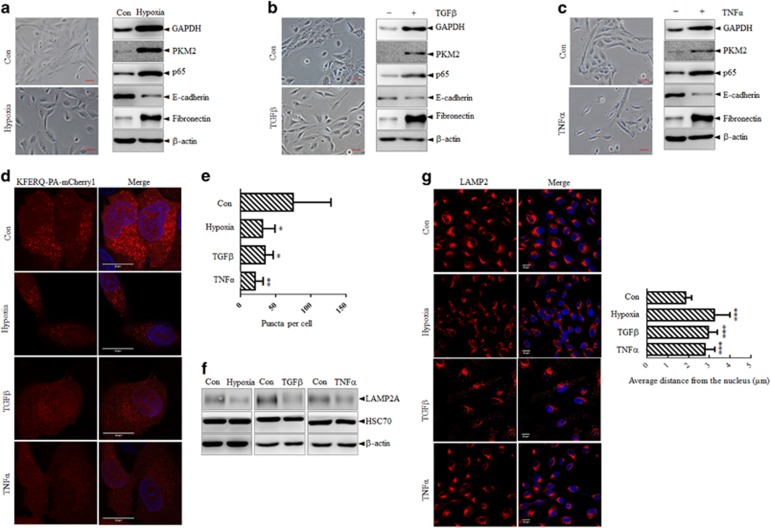
Reduction of CMA activity during hypoxia/TGFβ/TNFα induced EMT. (a–c) Induction of EMT in MCF-10A cells by hypoxia (a), TGFβ (b, 10 ng/ml) or TNFα (c, 10 ng/ml) treatment for 10 days. Phase-contrast morphology observation (left) and immunoblots for the indicated proteins (right) are shown. Scale bar represents 20 μm. (d, e) MCF-10A cells were stably infected with KFERQ-PA-mCherry1 and were stimulated with hypoxia/TGFβ/TNFα for EMT induction. Then, cells were photoactivated and maintained under serum starvation for 20 h to fully activate CMA. (d) Representative images of KFERQ- PA-mCherry1 puncta number and distribution in epithelial and mesenchymal MCF-10A cells induced by different treatments. Nuclei are labeled with DAPI. Scale bar represents 20 μm. (e) Quantitative analysis of the number of puncta per cell in >20 cells in at least eight different fields. *P<0.05 and **P<0.01 as compared with the puncta number in epithelial 10A-Con cells. (f) Immunoblots analysis of parental MCF-10A cells and MCF-10A cells induced by hypoxia, TGFβ and TNFα, respectively, for indicated proteins. (g) Left: immunofluorescence staining of LAMP2 together with re-staining of DAPI in parental MCF-10A cells and MCF-10A cells induced by hypoxia, TGFβ and TNFα, respectively. Scale bar represents 20 μm. Right: the distance of LAMP2 from the nucleus were measured using ImageJ. Twenty cells in each group were analyzed. Bar graphs represent the mean±s.d. The P-value was calculated using Student’s t-test. ***P<0.001 as compared with Con group.

