Figure 7.
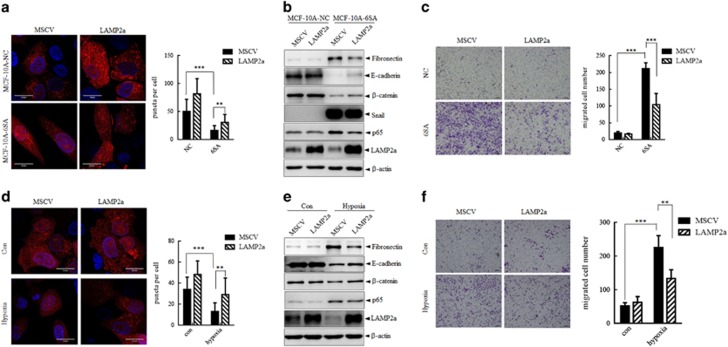
Rescuing CMA activity through LAMP2a overexpression leads to compromised EMT. (a–c) MCF-10A-NC and MCF-10A-6SA cells were infected with pMSCV or LAMP2a, respectively. (a) Left: representative images of KFERQ- PA-mCherry1 puncta number and distribution in each group. Nuclei are labeled with DAPI. Scale bar represents 20 μm. Right: quantitative analysis of the number of puncta per cell in >20 cells in at least eight different fields. **P<0.01 and ***P<0.001. (b) Immunoblots analysis of indicated proteins. (c) Migration ability were analyzed by Transwell assay. Representative images of migrated cells were shown left and quantitative analysis of the migrated cell number in five different fields were shown right. Scale bar represents 20 μm. ***P<0.001. (d–f) MCF-10A cells were stably infected with pMSCV or LAMP2a, respectively, and followed by incubation under hypoxia for EMT induction. (d) Left: representative images of KFERQ- PA-mCherry1 puncta number and distribution in each group. Nuclei are labeled with DAPI. Scale bar represents 20 μm. Right: quantitative analysis of the number of puncta per cell in >20 cells in at least eight different fields. **P<0.01 and ***P<0.001. (e) Immunoblots analysis of indicated proteins. (f) Migration ability was analyzed by Transwell assay. Representative images of migrated cells were shown left and quantitative analysis of the migrated cell number in five different fields was shown right. Scale bar represents 20 μm. **P<0.01 and ***P<0.001.

