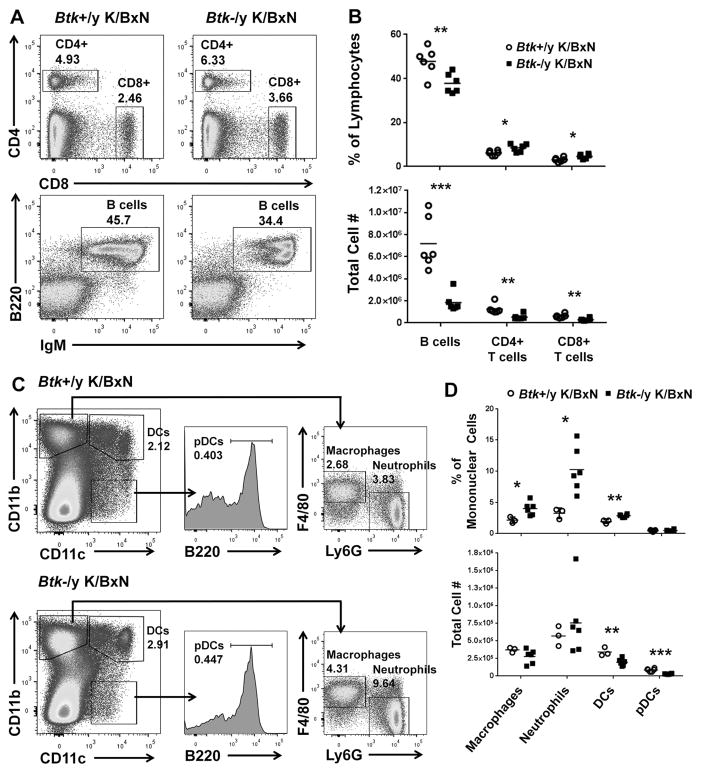
Figure 2. Immune cell numbers are decreased in the spleen of Btk-deficient K/BxNs compared to Btk-sufficient controls.
A) Representative flow plots for Btk-sufficient (left) and Btk-deficient (right) K/BxN, showing total T cells (top) and B cells (bottom). Cells are pre-gated on single live lymphocytes. T cells are gated as CD4+ and CD8+, while B cells are designated as B220+/IgM+. B) Quantification of T and B cell percentages of lymphocytes (top) and total cell number (bottom) in Btk-sufficient (circles, n=6) or –deficient (squares, n=6). C) Innate immune cells are shown by flow cytometry for a representative Btk-sufficient (top) or –deficient (bottom) K/BxN. Cells were gated as single live mononuclear cells. CD11b+CD11c− cells were gated as F4/80+Ly6G− for macrophages or F4/80−Ly6G+ for neutrophils. CD11b+CD11c+ cells were designated myeloid dendritic cells (DCs) and plasmacytoid dendritic cells (pDCs) were designated as CD11b−CD11c+B220+. D) Quantification of percentages (top) or total numbers (bottom) of innate immune cells in Btk-sufficient (n=3–7) or Btk-deficient (n=6–8) K/BxN. *p≤0.05, **p≤0.01, ***p≤0.001, as calculated by the Holm-Sidak method of multiple T tests.

