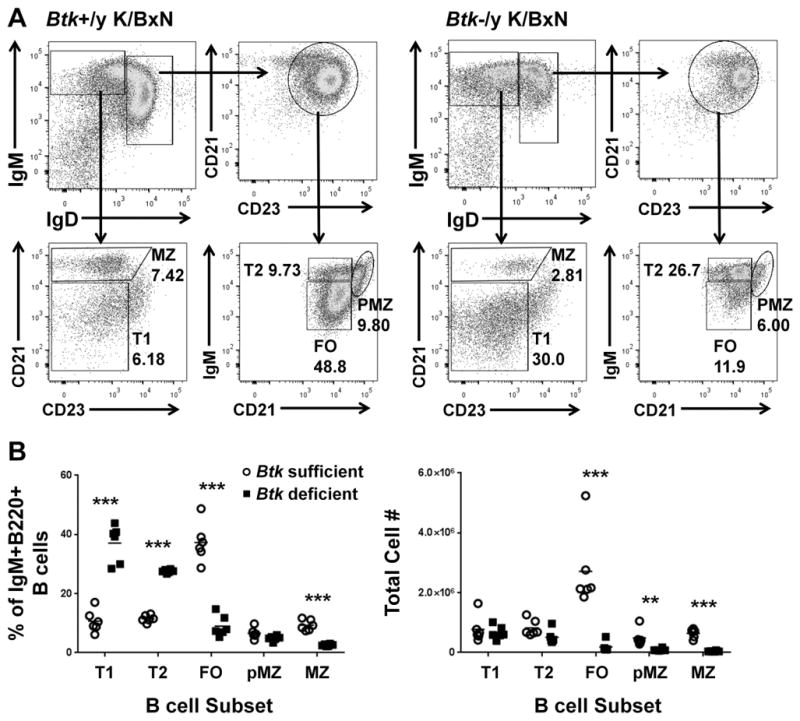
Figure 3. Btk-deficiency reduces mature B cell subsets in K/BxNs.

A) Representative flow plots for Btk-sufficient (left) and Btk-deficient (right) K/BxN, showing gating scheme for B cell subsets. Cells are gated as single, live, B220+ lymphocytes. B) Quantification of B cell subsets in Btk-sufficient (circles, n=6) or –deficient (squares, n=6) K/BxN by percentage of total IgM+IgD+ B cells (left) and by total cell number (right). **p≤0.01, ***p≤0.001, as calculated by the Holm-Sidak method of multiple T tests.
