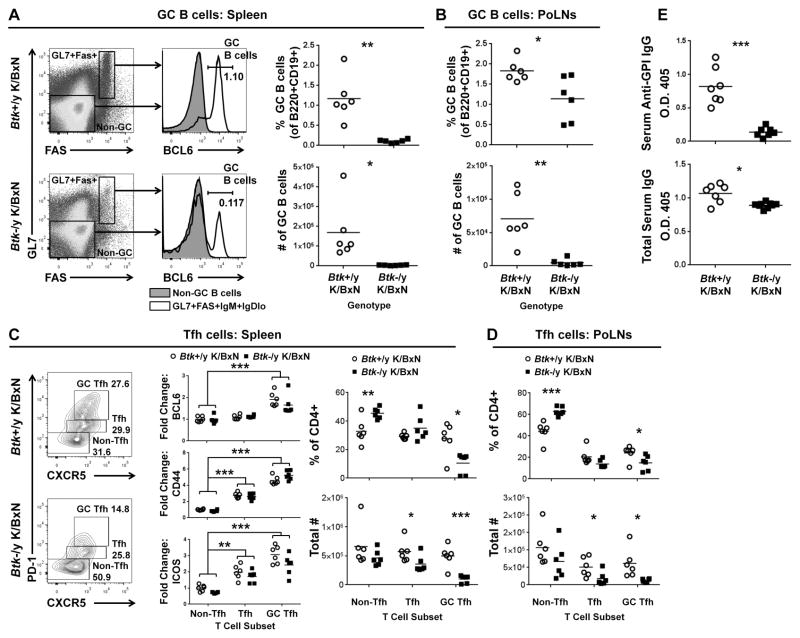
Figure 4. GC B cells and T follicular helper cells are decreased in Btk-deficient K/BxNs.
A) Representative flow plots of Btk-sufficient and –deficient K/BxN B220+CD19+ live splenocytes. IgMhiIgDlo gating was applied (not shown) and GL7+Fas+ cells (white) or GL7−Fas− controls (gray) evaluated for GC marker BCL6. GC B cells (GL7+Fas+IgMhiIgDloBCL6+) were quantified as percent of B cells, and total number in spleen (A, right panel) and popliteal LNs (B). C) Representative plots of splenic CD4+ live lymphocytes stained for Tfh markers PD-1 and CXCR5. Expression levels of BCL6, CD44 and ICOS in GC Tfh (PD1hiCXCR5hi) and Tfh (PD1+CXCR5+), shown as fold change over Btk-sufficient K/BxN non-Tfh cells (middle panel). GC Tfh, Tfh and non-Tfh were quantified as percentage of CD4+ cells (top) or total cell number (bottom) for spleen (C, right) and popliteal LNs (D). E) Serum anti-GPI IgG (top) and total IgG (bottom) were quantified by ELISA. Btk-sufficient, circles, n=6 for A–D; n=7–8 for E; Btk-deficient, squares, n=6 for A–D, n=7–9 for E. *p≤0.05, **p≤0.01, ***p≤0.001, calculated by unpaired T test with Welch’s correction (A, B, E), the Holm-Sidak method of multiple T tests (C right, D) or by a multi-way AVOVA with Sidak correction (C middle).

