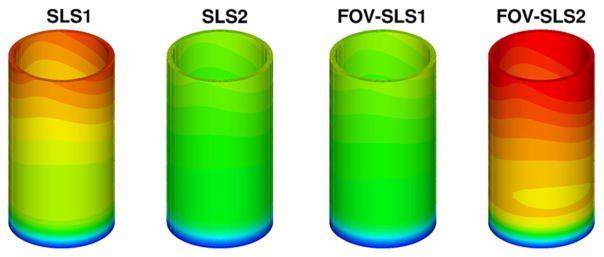
Fig. 10.
Displacements (in millimeters) for the viscoelastic models in the idealized artery simulations at systolic peak . From left to right are obtained with: model SLS1; model SLS2; model FOV-SLS1 and model FOV-SLS2. (For interpretation of the colors in this figure, the reader is referred to the web version of this article.)

