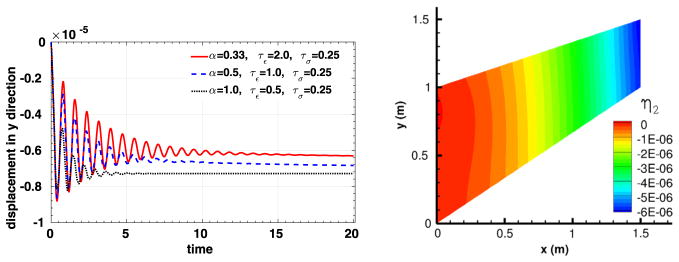
Fig. 6.
Simulation results for the second convergence test. Left: time traces of the displacement at the right end of the object (x =1.5). Right: displacement distribution in y direction when α = 0.33, τε = 2.0, τσ = 0.25 and time = 20 (for interpretation of the colors in this figure, the reader is referred to the web version of this article).

