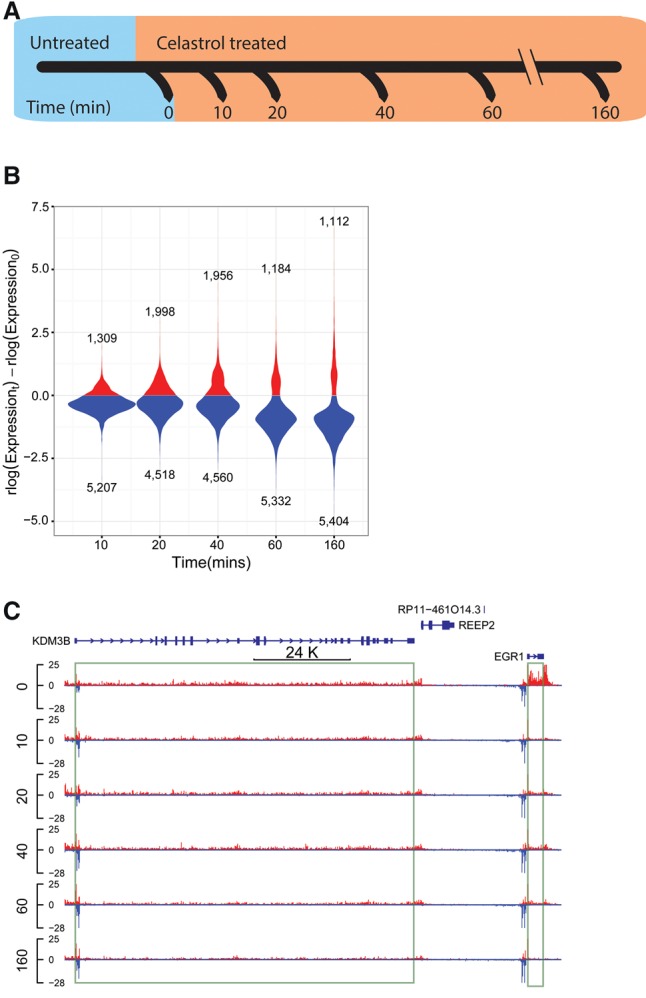
Figure 1.

Characterizing the dynamic transcriptional response to celastrol using PRO-seq. (A) PRO-seq was applied to K562 cells collected before celastrol treatment (untreated/0 min) and at 10, 20, 40, 60, and 160 min after celastrol treatment. Two biological replicates were performed for each time point. (B) Distribution of log expression ratios (treated vs. untreated) for each time point (rlog is a regularized log2 estimate obtained from DESeq2). Only genes classified as differentially expressed (DE) throughout the time course are represented. Notice that most DE genes (FDR ≤ 0.01) are down-regulated upon celastrol treatment. (C) A UCSC Genome Browser display showing raw PRO-seq data for two differentially expressed genes, EGR1 and KDM3B. EGR1 is rapidly and strongly repressed (immediate decrease of ∼80%), whereas KDM3B is more gradually repressed, losing ∼50% of its expression by 160 min.
