Figure 3.
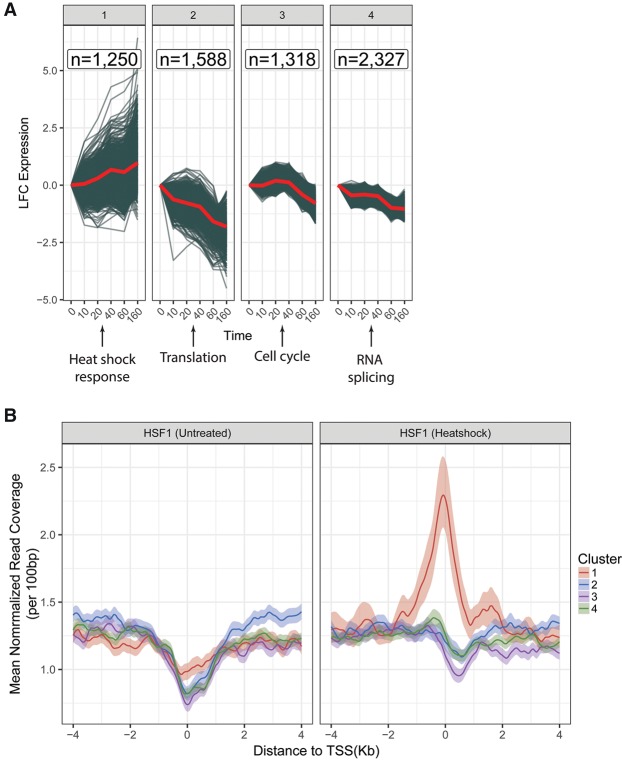
Clusters of genes showing distinct temporal patterns of response to celastrol. (A) Differentially expressed genes (FDR ≤ 0.01) clustered by time series of log2 fold change (LFC) in expression relative to the untreated condition (0 min). Each gene is represented by a blue line, and the red lines indicate the mean expression per time point per cluster. Below each cluster is a summary of the enriched terms in the Reactome ontology (FDR ≤ 0.01) (see Supplemental Material for details; Fabregat et al. 2016). (B) ChIP-seq data from Vihervaara et al. (2013) describing binding of HSF1 in K562 cells under normal (left) and heat shock (right) conditions, stratified by our cluster assignments. Each line represents an average over all genes in the cluster in the region of the TSS, with lighter-colored bands representing 95% confidence intervals obtained by bootstrap sampling. Notice that cluster #1 is unique in showing a strong enrichment for heat shock-induced binding of HSF1.

