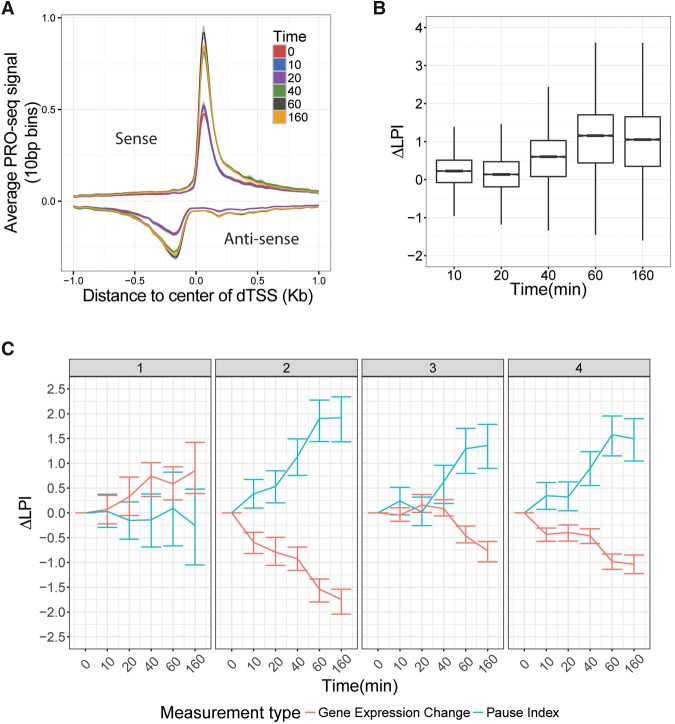
Figure 5.
Increased promoter-proximal pausing is associated with transcriptional repression in the response to celastrol. (A) Mean PRO-seq signal at promoters for all active genes, grouped by time point and oriented with respect to the direction of transcription of the gene. The x-axis represents distance to the center between the divergent transcription start sites (see Methods). Intervals around each line represent 95% confidence intervals obtained by bootstrap sampling. Notice the general increase in the height of the pause peaks with time. (B) The distribution of changes in the log fold index with respect to the untreated condition (ΔLPI) (see Methods) for all active genes at each time point. The notch corresponds to median ±1.58×IQR/√n, roughly a 95% confidence interval of the median. (C) The distribution of ΔLPI for all DE genes (FDR ≤ 0.01) by cluster and time point. Notice that all clusters show an increase in the pause index with time, except for cluster #1. Error bars indicate the 25th and 75th percentiles of the data.

