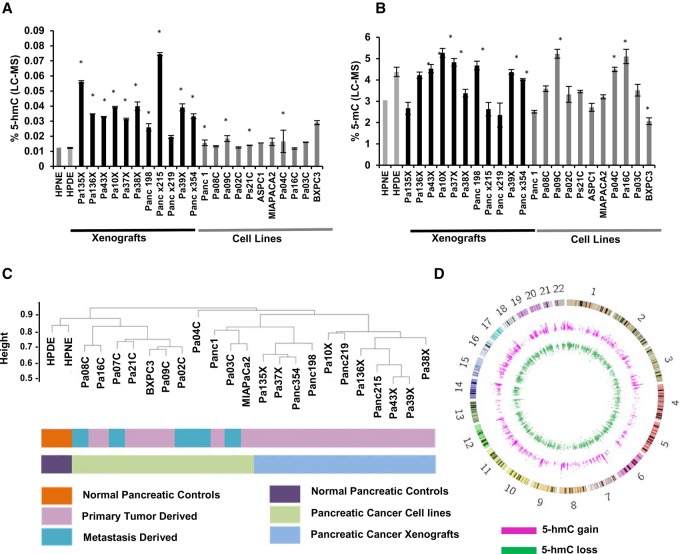
Figure 1.
Altered patterns of hydroxymethylation are seen in pancreatic cancer cell lines and primary xenografts. Total 5-hmC (A) and 5-mC (B) levels were measured by LC-MS in pancreatic cancer cell lines primary xenograft tumors and immortalized healthy pancreatic controls (HPNE, HPDE, gray). Values are expressed as a percentage of total cytosine. (*) P-value <0.05 when compared to HPNE, t-test. (C) Unsupervised clustering based on 5-hmC peaks demonstrates dissimilarity between controls and pancreatic cancer cells. (D) Circos plot (Krzywinski et al. 2009) shows genome-wide distribution of regions that gain and lose 5-hmC in pancreatic cancer cells.

