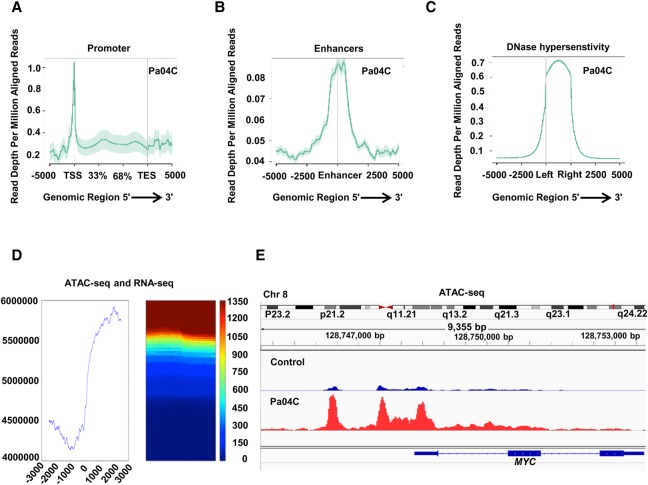
Figure 3.
Chromatin accessibility patterns from ATAC-seq in pancreatic cancer define regulatory regions of the genome. (A–C) ATAC-seq peaks in Pa04C pancreatic cancer cells are enriched in promoter regions (A), known enhancers (B), and known DNase hypersentivity regions (C). (D) Correlation of ATAC-seq peaks with RNA-seq shows proximity to highly expressed transcripts. (E) Example of highly expressed MYC oncogene that shows larger ATAC-seq peaks in pancreatic cancer cells when compared to controls.

