Figure 4.
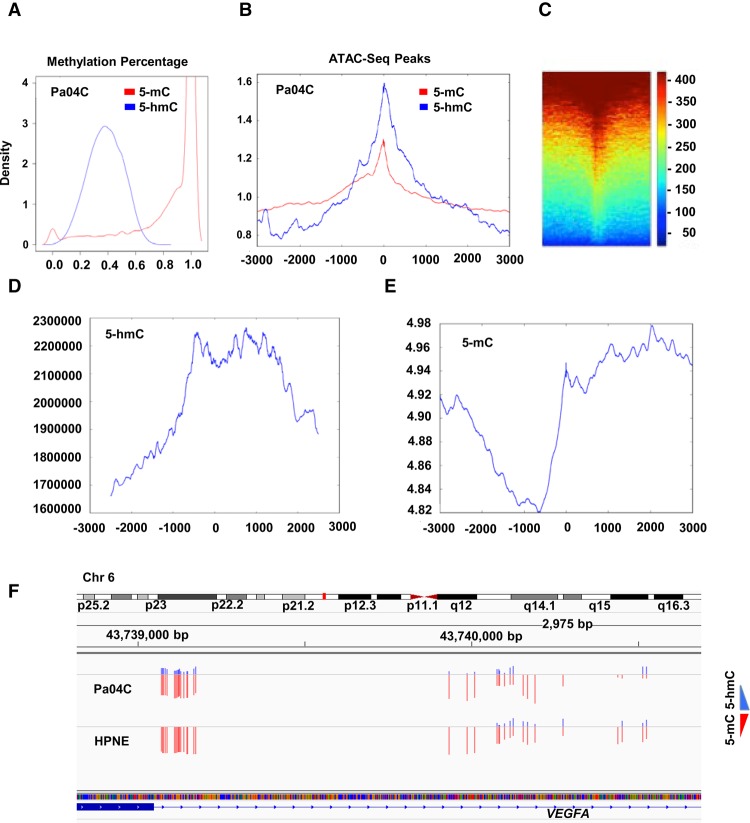
5-hmC obtained from OXBS correlates with regions of open chromatin and gene expression. (A) Density plot shows percentage of 5-hmC and 5-mC in CpGs in pancreatic cancer cells. (B) Colocalization of 5-hmC/5-mC with ATAC-seq peaks shows 5-hmC is enriched at areas of open chromatin when compared to 5-mC (P < 0.0001, permutation test on differences in kurtosis). (C) Heatmap shows colocalization of 5-hmC with ATAC-seq peaks. (D,E) Colocalization of 5-hmC loci with RNA-seq shows higher 5-hmC and lower 5-mC at promoters with expressed transcripts. (F) Example of highly expressed VEGFA oncogene, shows similar amounts of 5-mC, but higher amounts of 5-hmC in pancreatic cancer cells when compared to controls.

