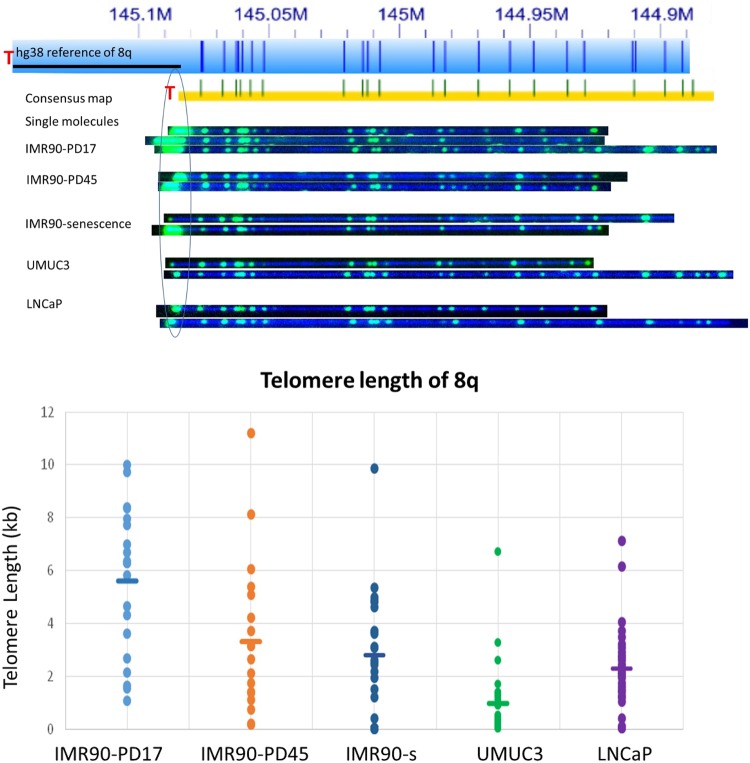
Figure 4.
Single-telomere length analysis results for 8q. (Top) The hg38 subtelomere reference sequence for 8q is shown as a light blue bar; the dark blue vertical ticks within these bars indicate in silico Nt.BspQI nick-label sites. The black line segment designates a telomere-adjacent gap in the hg38 reference sequence. The green lines on the consensus maps are Nt.BspQI (GCTCTTC) sites that align to the corresponding reference site. Those that do not align with the reference are designated with light blue lines. Representative examples of raw images of single molecules from two-color labeling experiments for each of the samples that were used to create the consensus map are shown. The human diploid fibroblast cell line IMR90 was sampled at population doubling 17 (IMR90-PD17), at PD45 (IMR90-PD45), and at senescence (IMR90-senescence; PD61). The immortal telomerase-positive cancer cell lines UMUC3 (bladder cancer) and LNCaP (prostate cancer) were also sampled. (Bottom) Telomere (TTAGGG)n tract length results for 8q from each of these samples. Each single-molecule telomere length measurement for 8q is represented by a dot, and the average telomere length for 8q in each sample is shown as a horizontal line.

