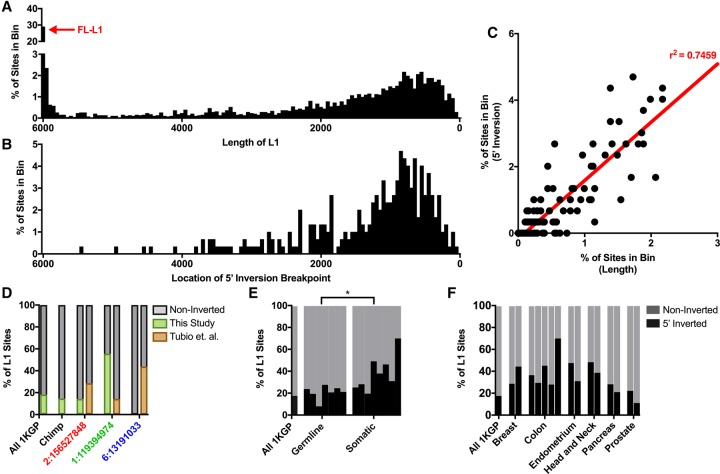
Figure 5.
L1 5′ inversions in germline and somatic tissues. (A) L1 length distribution among sites discovered in the 1000 Genomes Project Phase III samples. (B) 5′ inversion positions discovered in the 1000 Genomes Project Phase III samples (Supplemental Table S10). (C) Correlation between the distributions shown in A and B, with the linear trend line and r2 correlation shown in red. FL-L1 (red arrow in A) sites were excluded from this comparison because no correlation was observed in the first ∼590 bp of FL-L1 elements. (D) 5′ inversion rates among all L1 sites in the 1000 Genomes Project, chimpanzee, and among particularly active 3′ transducers highlighted in Figure 3, C–E. (E) Total number of 5′ inverted sites from 1000 Genomes Project MEIs (this study) compared with other germline and somatic studies. The proportion of 5′ inverted sites is significantly different ([*] P = 0.0207) between germline and somatic insertions (Supplemental Table S10). (F) Comparison of germline 5′ inversion rates (1000 Genomes Project MEIs) and several different tumor types analyzed by various studies (Supplemental Table S10).

