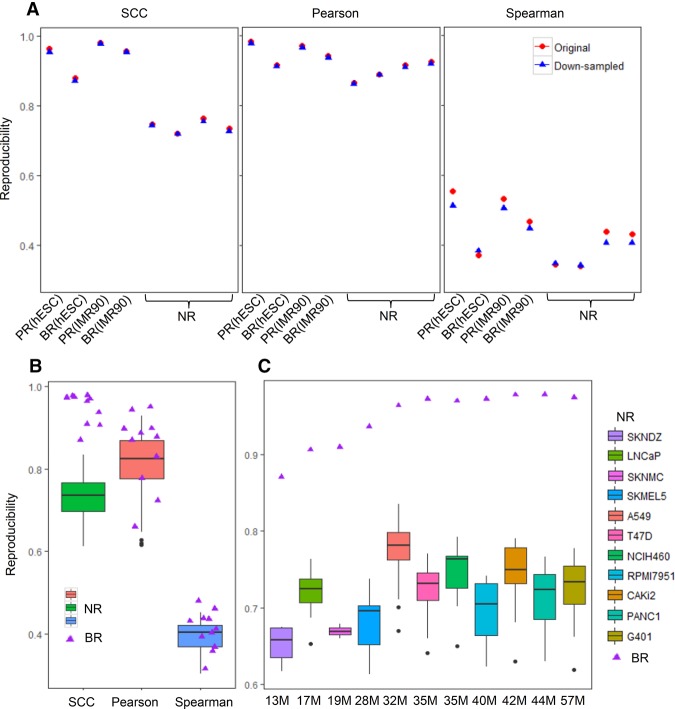
Figure 3.
Discrimination of pseudoreplicates (PR), biological replicates (BR), and nonreplicates (NR). (A) Reproducibility scores for the illustration example (hESC and IMR90 cell lines) in Figure 1. Red dots are the results in the original samples, and blue dots are the results after equalizing the sequencing depth in all samples. (B,C) Reproducibility scores for the BR and NR in the ENCODE 11 cancer cell lines. The triangle represents the score for a BR, and the box plot represents the distribution of the scores for NRs. (B) Reproducibility scores for BRs and NRs in all cell types. (C) SCC for BRs and the corresponding NRs in each cell type. From left to right, the cell lines are ordered according to the average sequencing depths of the biological replicates.

