
Figure 7.
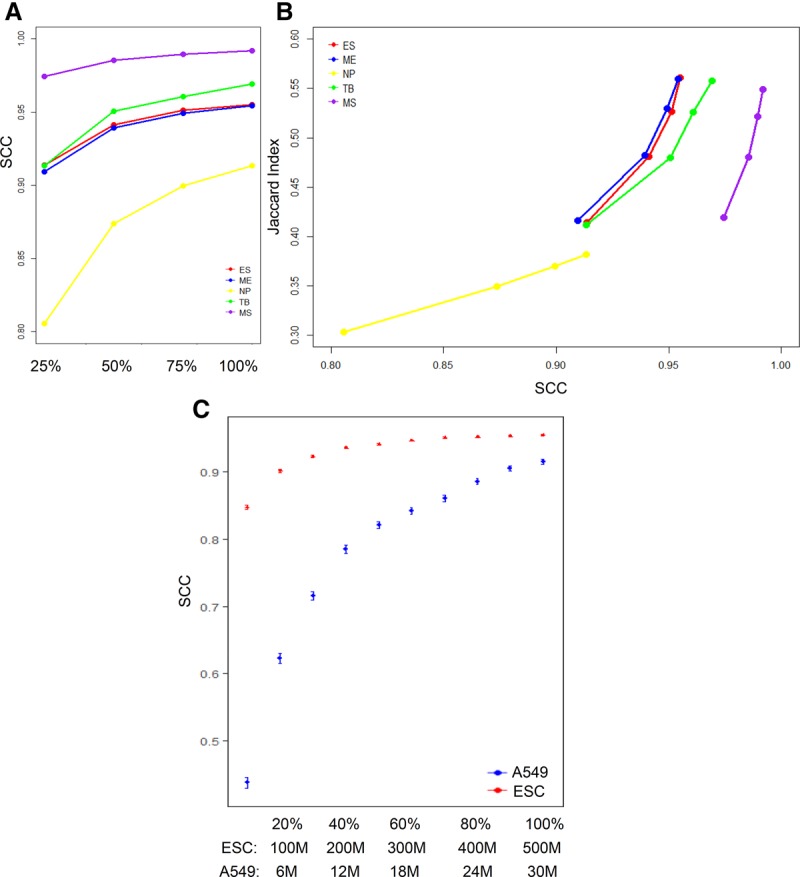
Detecting the change of reproducibility due to sequencing depth using SCC. (A) SCC of downsampled biological replicates (25%, 50%, 75%, and 100% of the original sequencing depth) for the five cell lines on the H1 ES cell lineage. (B) Relationship between SCC and Jaccard index, which measures the proportion of shared significant contacts identified by Fit-Hi-C between replicates for samples in A. (C) Saturation curves of SCC for data sets with different coverages. The SCC is plotted at different subsamples (10%–90%) of the original samples with 90% confidence intervals. The blue dots represent H1 human ESC data (original sequencing depth = 500 M). The red dots represent the A549 data (original sequencing depth = 30 M).