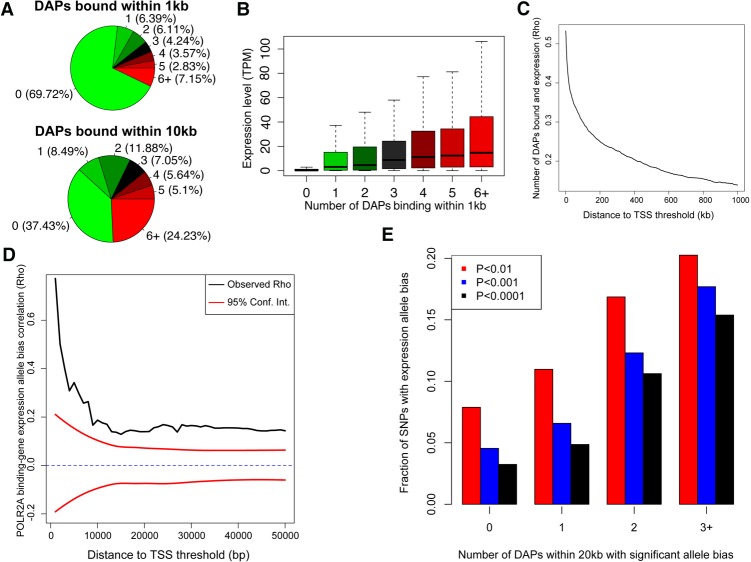
Figure 2.
DAP occupancy correlates with gene expression. (A) Pie chart representing the percentage of genes containing a specified number of bound DAPs within 1 kb of their TSS. (B) Expression level of genes binned by the number of DAPs bound within 1 kb of their TSS in the adult/male donor. (C) Correlation between expression level of genes and the number of factors bound (as described in B) for a range of distance to TSS thresholds. Correlations are aggregated cumulatively. (D) Correlation between POLR2A binding and neighboring gene expression allele bias over a range of distance thresholds. Ninety-five percent confidence intervals (red) were calculated by randomly shuffling all SNP pairs that met a distance threshold 100 times. (E) Bar plot showing the fraction of expressed SNPs with significant allele bias with varying numbers of neighboring DAPs that also exhibited allele bias within 20 kb.

