
Fig. 1.
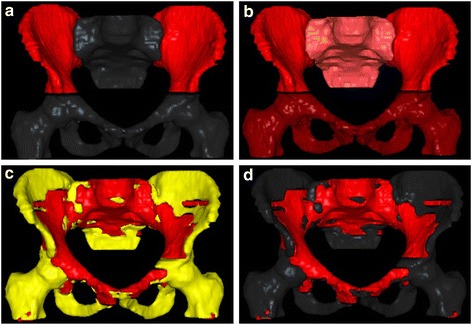
Visual representation of the 4 planning approaches. Bone marrow is represented in red. Optimization was addressed to iliac crest in Plan A (a), the whole pelvic bones defined as external osseous contour in Plan B (b), active (red) and inactive (yellow) bone marrow as defined with 18FDG-PET (c) with a higher priority for active and a lower for inactive, active bone marrow only as defined with 18FDG-PET (d)