Fig. 6.

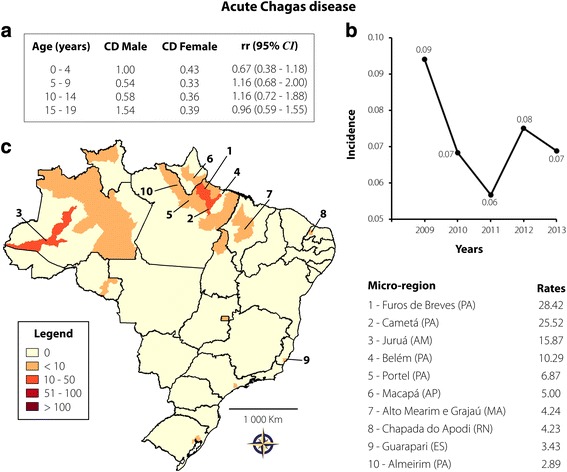
Acute Chagas disease transmission in Brazil from 2009 to 2013 in individuals aged 0–19 years. a CD and rr, according to age and gender; b Rate of reported cases per 100,000 inhabitants according to year of notification; c Spatial distribution adopting the microregion as the unit of analysis. On the right are 10 microregions that reported the highest case rates per 100,000 inhabitants
