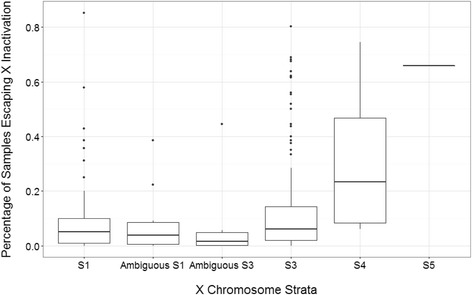
Fig. 1.

Percentage of samples that escape X inactivation across different evolutionary strata. Each data point plots the number of samples that express both copies of a gene. Strata are organized by evolutionary time and position on the X chromosome, where S1 is the oldest stratum and S5 the youngest stratum. All genes are supported by at least five data points in the population
