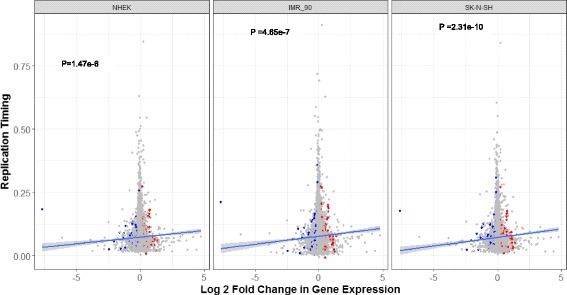
Fig. 6.

Replication timing in three ENCODE cell lines as a function of sex bias in gene expression. Higher log2 fold change values indicate female-biased gene expression, while higher replication timing values indicate earlier replication timing. Red and blue points indicate statistically significant female-biased and male-biased genes, respectively, based on genes classified as sex biased by the GTex consortium. Blue lines indicate the fitted univariate regression lines for each cell type; P values indicate the statistical significance of the slope
