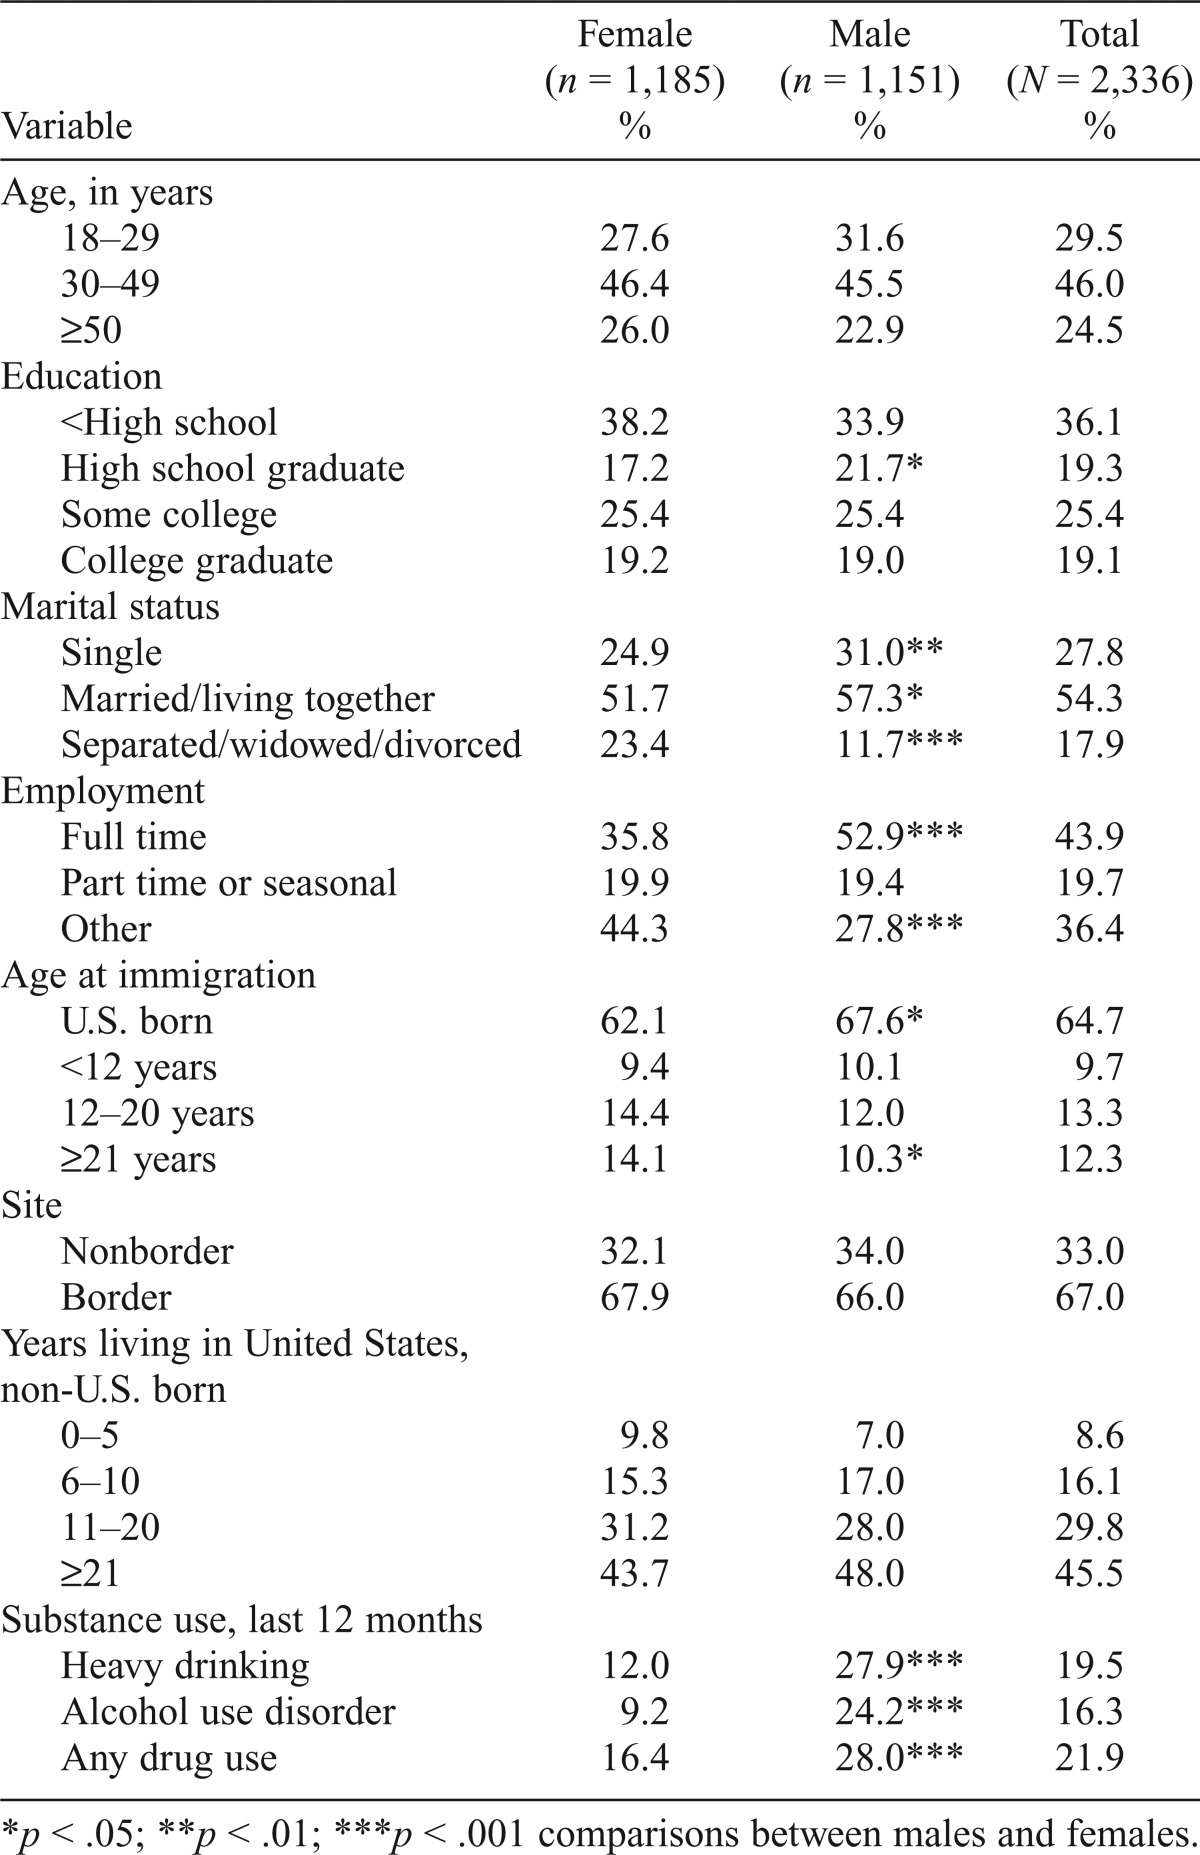
Table 1.
Demographic and substance use characteristics by gender
| Variable | Female (n = 1,185) % | Male (n = 1,151) % | Total (N = 2,336) % |
| Age, in years | |||
| 18–29 | 27.6 | 31.6 | 29.5 |
| 30–49 | 46.4 | 45.5 | 46.0 |
| ≥50 | 26.0 | 22.9 | 24.5 |
| Education | |||
| <High school | 38.2 | 33.9 | 36.1 |
| High school graduate | 17.2 | 21.7* | 19.3 |
| Some college | 25.4 | 25.4 | 25.4 |
| College graduate | 19.2 | 19.0 | 19.1 |
| Marital status | |||
| Single | 24.9 | 31.0** | 27.8 |
| Married/living together | 51.7 | 57.3* | 54.3 |
| Separated/widowed/divorced | 23.4 | 11 7*** | 17.9 |
| Employment | |||
| Full time | 35.8 | 52.9*** | 43.9 |
| Part time or seasonal | 19.9 | 19.4 | 19.7 |
| Other | 44.3 | 27.8*** | 36.4 |
| Age at immigration | |||
| U.S. born | 62.1 | 67.6* | 64.7 |
| <12 years | 9.4 | 10.1 | 9.7 |
| 12–20 years | 14.4 | 12.0 | 13.3 |
| ≥21 years | 14.1 | 10.3* | 12.3 |
| Site | |||
| Nonborder | 32.1 | 34.0 | 33.0 |
| Border | 67.9 | 66.0 | 67.0 |
| Years living in United States, non-U.S. born | |||
| 0–5 | 9.8 | 7.0 | 8.6 |
| 6–10 | 15.3 | 17.0 | 16.1 |
| 11–20 | 31.2 | 28.0 | 29.8 |
| ≥21 | 43.7 | 48.0 | 45.5 |
| Substance use, last 12 months | |||
| Heavy drinking | 12.0 | 27.9*** | 19.5 |
| Alcohol use disorder | 9.2 | 24.2*** | 16.3 |
| Any drug use | 16.4 | 28.0*** | 21.9 |
p < .05;
p < .01;
p < .001 comparisons between males and females.

