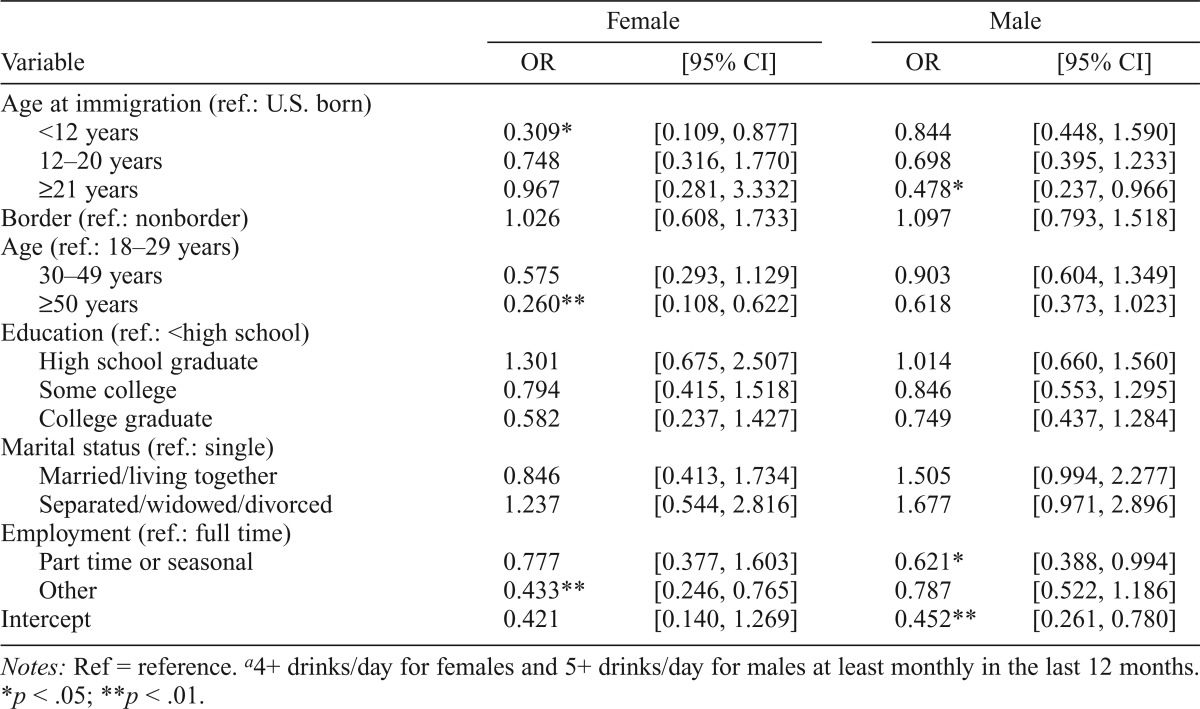
Table 2.
Odds ratios (ORs) and 95% confidence intervals (CIs) for age at immigration on heavy alcohol usea for males and females
| Variable | Female |
Male |
||
| OR | [95% CI] | OR | [95% CI] | |
| Age at immigration (ref.: U.S. born) | ||||
| <12 years | 0.309* | [0.109, 0.877] | 0.844 | [0.448, 1.590] |
| 12–20 years | 0.748 | [0.316, 1.770] | 0.698 | [0.395, 1.233] |
| ≥21 years | 0.967 | [0.281, 3.332] | 0.478* | [0.237, 0.966] |
| Border (ref.: nonborder) | 1.026 | [0.608, 1.733] | 1.097 | [0.793, 1.518] |
| Age (ref.: 18–29 years) | ||||
| 30–49 years | 0.575 | [0.293, 1.129] | 0.903 | [0.604, 1.349] |
| ≥50 years | 0.260** | [0.108, 0.622] | 0.618 | [0.373, 1.023] |
| Education (ref.: <high school) | ||||
| High school graduate | 1.301 | [0.675, 2.507] | 1.014 | [0.660, 1.560] |
| Some college | 0.794 | [0.415, 1.518] | 0.846 | [0.553, 1.295] |
| College graduate | 0.582 | [0.237, 1.427] | 0.749 | [0.437, 1.284] |
| Marital status (ref.: single) | ||||
| Married/living together | 0.846 | [0.413, 1.734] | 1.505 | [0.994, 2.277] |
| Separated/widowed/divorced | 1.237 | [0.544, 2.816] | 1.677 | [0.971, 2.896] |
| Employment (ref.: full time) | ||||
| Part time or seasonal | 0.777 | [0.377, 1.603] | 0.621* | [0.388, 0.994] |
| Other | 0.433** | [0.246, 0.765] | 0.787 | [0.522, 1.186] |
| Intercept | 0.421 | [0.140, 1.269] | 0.452** | [0.261, 0.780] |
Notes: Ref = reference.
4+ drinks/day for females and 5+ drinks/day for males at least monthly in the last 12 months.
p <.05;
p <.01.

