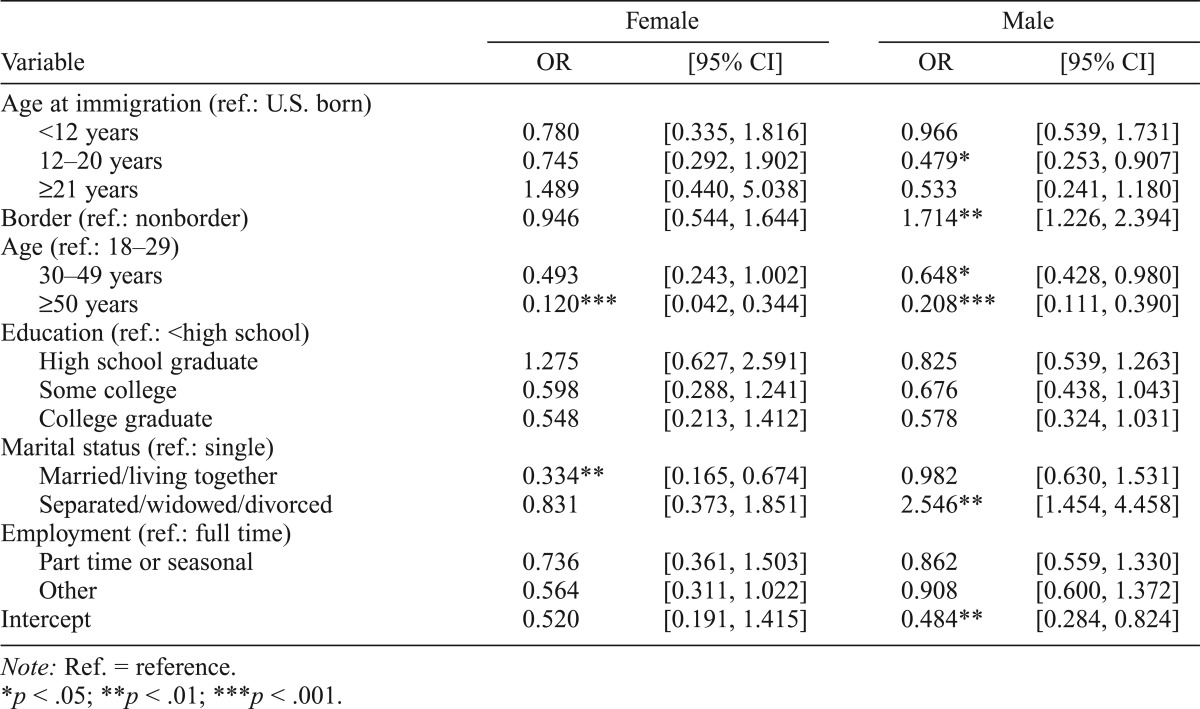
Table 3.
Odds ratios (ORs) and 95% confidence intervals (CIs) for age at immigration on alcohol use disorders for males and females
| Variable | Female |
Male |
||
| OR | [95% CI] | OR | [95% CI] | |
| Age at immigration (ref.: U.S. born) | ||||
| <12 years | 0.780 | [0.335, 1.816] | 0.966 | [0.539, 1.731] |
| 12–20 years | 0.745 | [0.292, 1.902] | 0.479* | [0.253, 0.907] |
| ≥21 years | 1.489 | [0.440, 5.038] | 0.533 | [0.241, 1.180] |
| Border (ref.: nonborder) | 0.946 | [0.544, 1.644] | 1.714** | [1.226, 2.394] |
| Age (ref.: 18–29) | ||||
| 30–49 years | 0.493 | [0.243, 1.002] | 0.648* | [0.428, 0.980] |
| ≥50 years | 0.120*** | [0.042, 0.344] | 0.208*** | [0.111, 0.390] |
| Education (ref.: <high school) | ||||
| High school graduate | 1.275 | [0.627, 2.591] | 0.825 | [0.539, 1.263] |
| Some college | 0.598 | [0.288, 1.241] | 0.676 | [0.438, 1.043] |
| College graduate | 0.548 | [0.213, 1.412] | 0.578 | [0.324, 1.031] |
| Marital status (ref.: single) | ||||
| Married/living together | 0.334** | [0.165, 0.674] | 0.982 | [0.630, 1.531] |
| Separated/widowed/divorced | 0.831 | [0.373, 1.851] | 2.546** | [1.454, 4.458] |
| Employment (ref.: full time) | ||||
| Part time or seasonal | 0.736 | [0.361, 1.503] | 0.862 | [0.559, 1.330] |
| Other | 0.564 | [0.311, 1.022] | 0.908 | [0.600, 1.372] |
| Intercept | 0.520 | [0.191, 1.415] | 0.484** | [0.284, 0.824] |
Note: Ref. = reference.
p < .05;
p < .01;
p < .001.

