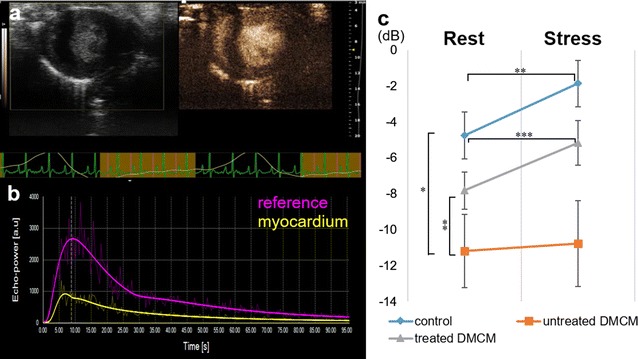
Fig. 5.

Myocardial contrast echocardiography shows improved microvascular function after cell sheet implantation. a images at 4-week end-point with a B-mode image on the left and a nonlinear contrast image on the right. b Typical video intensity graph generated during imaging. c At rest, peak video intensity in untreated diabetic animals was significantly lower than in nondiabetic controls and animals treated with cell sheet implantation. Following vasodilator-induced stress, peak video intensity was unchanged in the untreated group, whereas the nondiabetic control and cell sheet-treated groups demonstrated increased peak video intensities. *P < 0.001, **P < 0.05, ***P < 0.01
