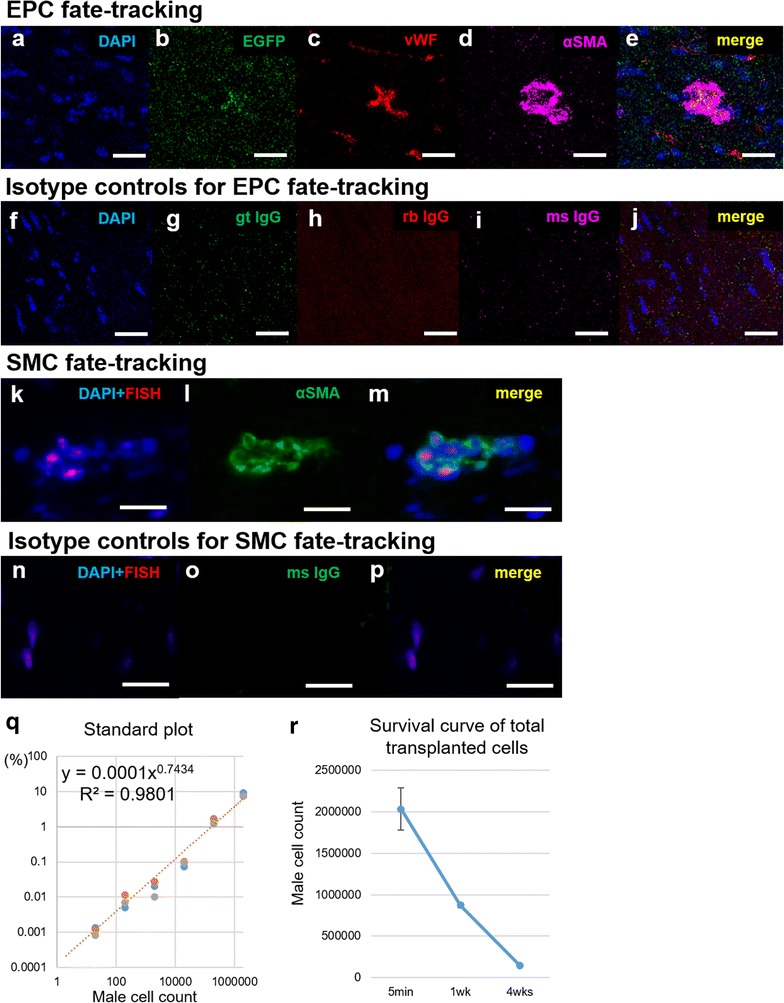
Fig. 7.

Fate tracking and survival rate of transplanted cells. a–j Fate tracking was performed with EGFP-labeled EPCs. EGFP and vWF double-positive cells were detected in the specimens 1 week after implantation (a–e). Images of isotype controls were provided (f–j). k–p SMCs were tracked with FISH for sry gene of male cells. Y-chromosome and αSMA double-positive cells were also detected in the specimens 1 week after implantation (k–m), and images of isotype controls were provided (n–p). q–r To assess the survival rate of the EPC-SMC bi-level cell sheet after transplant, the copy number of sry gene of male cells was measured with a fluorescent-based quantitative PCR. Samples with known numbers of male transplanted cells produced a standard plot with high correlation coefficient (r2 = 0.980, q). A survival curve of total transplanted cells was then generated (r). Image scale bars, 10 µm in a–j, 20 µm in k–p. αSMA alpha smooth muscle actin, EGFP enhanced green fluorescent protein, DAPI 4′,6-diamidino-2-phenylindole, FISH fluorescence in situ hybridization, gt IgG goat immunoglobulin G, ms IgG mouse immunoglobulin G, rb IgG, rabbit immunoglobulin G, vWF von Willebrand factor
