
Figure 2.
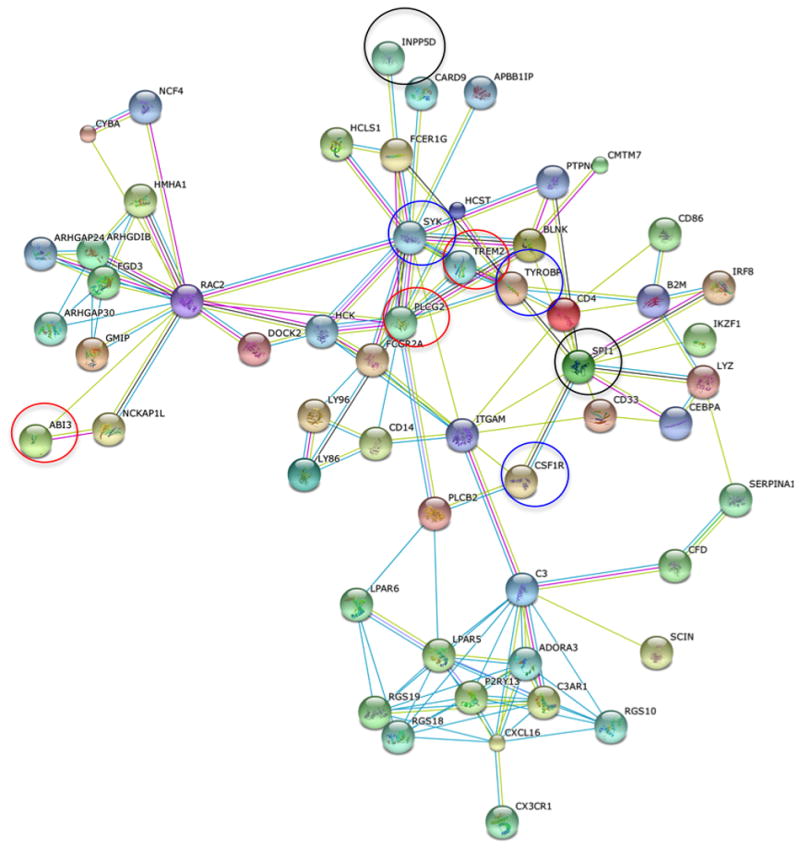
Protein-protein interaction network (using high-confidence human interactions from the STRING database) of 56 genes enriched for both common and rare variants associated with AD risk. Colours of edges refer to the type of evidence linking the corresponding proteins: red=gene fusion, dark blue = co-occurrence, black = co-expression, magenta = experiments, cyan=databases, light green = text mining, mauve = homology. TREM2, PLCG2 and ABI3 highlighted by red circles, SYK, CSF1R and TYROBP highlighted by blue circles, and INPP5D, SPI1 and CD33 identified as common variant risk loci2,5-7, highlighted by black circles.