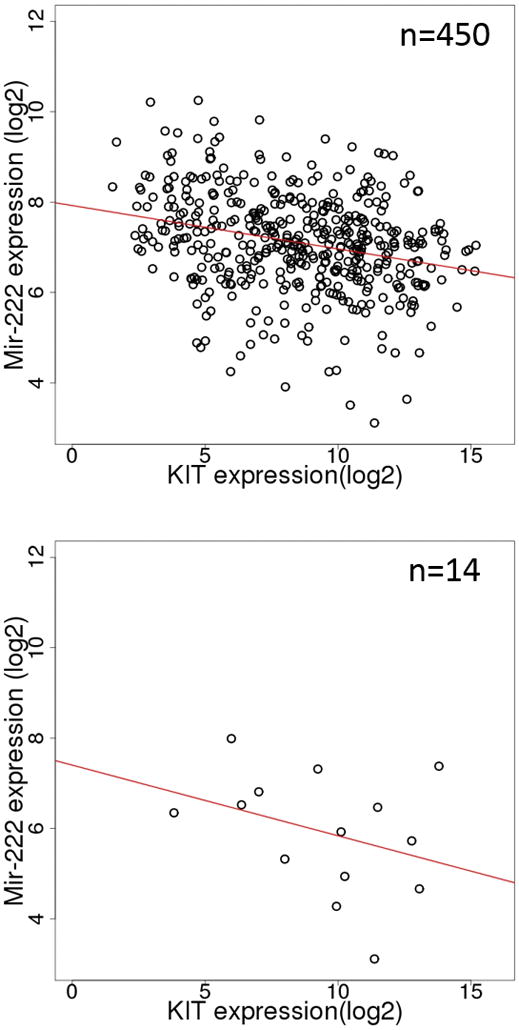
Figure 6.

Scatter plots of KIT and mir-222 expression in all SKCM tumors (top) and BRAF V600K only SKCM tumors (bottom). The red lines are the least-squares fits. In this Figure, we first identified matching RNA-seq and miRNA-seq samples and extracted KIT expression and mir-222 expression respectively.
