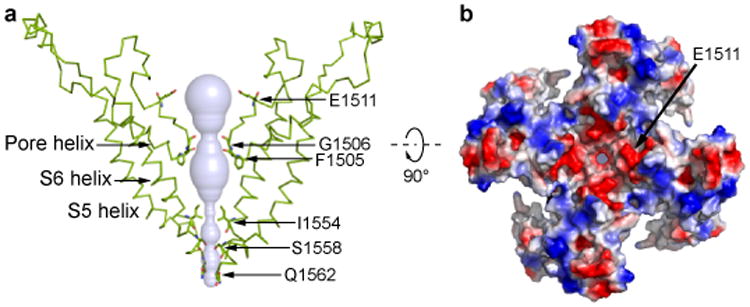
Figure 2. Architecture of the ion permeation pathway of NOMPC.

a, Solvent-accessible pathway along the ion permeation pore illustrated as blue surface. Residues located at the selectivity filter and lower gate are rendered as sticks. b, Top view of the NOMPC pore region is shown in surface representation, colored by the electrostatic potentials (negative: red; positive: blue).
