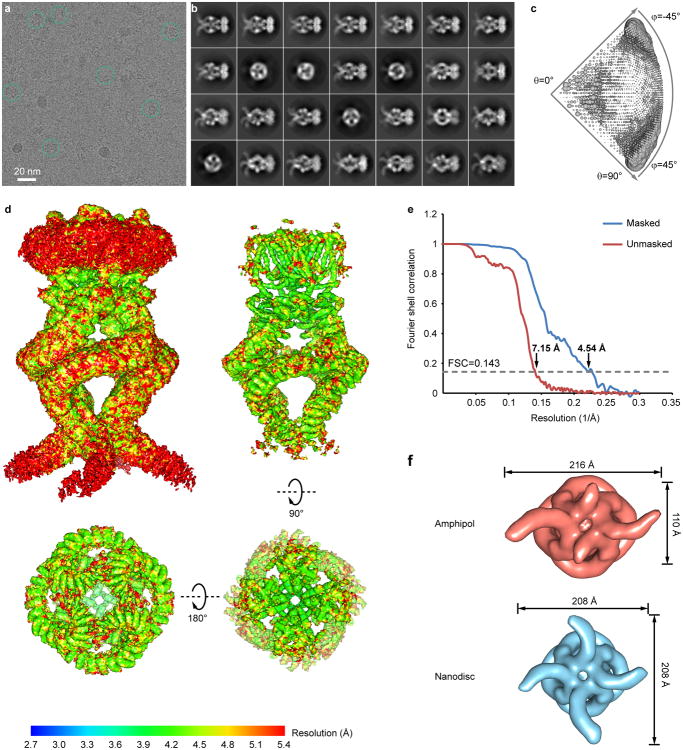
Extended Data Figure 3. Cryo-EM analysis of NOMPC in amphipol.
a, A raw cryo-EM micrograph of NOMPC recorded as described in Methods. b, 2D class averages of the cryo-EM micrographs with a particle box size of 400 pixels (486Å). c, Euler angle distribution of all particles used for the final 3D reconstruction. The size of the sphere is proportional to the amount of particles visualized from that specific orientation. d, Final unsharpened 3D density map of NOMPC-amphipol colored with local resolution at a low isosurface level (top left) to enable visualization of the amphipol layer, and at a high isosurface level in side (top right), top (bottom right) and bottom (bottom left) views. e, FSC curves between two independently refined half maps before (red) and after (blue) post-processing in RELION, indicated with resolutions corresponding to FSC=0.143. f, Density maps of NOMPC in amphipol (top) and in nanodisc (bottom) with a C1 symmetry derived from all particles picked. Comparison of the maps shows NOMPC-nanodisc is closer to a four-fold symmetric structure.

