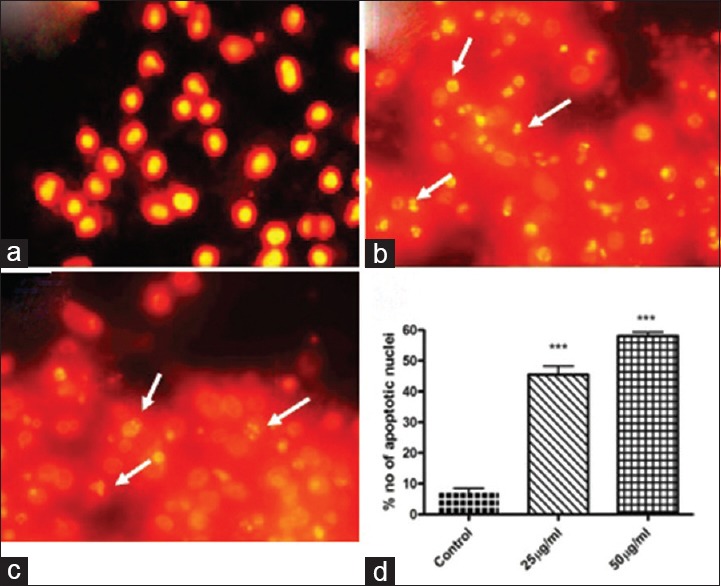
Figure 5.

Nuclear morphology analysis by propidium iodide staining (×10). (a) Control; (b) Acacia catechu seed extract 25 μg/ml treatment; (c) Acacia catechu seed extract 50 μg/ml treatment. White arrow indicate the apoptotic cells with fragmented nuclei. (d) Quantification of apoptotic nuclei. Values are expressed as mean ± standard error mean (n = 3). ***P < 0.001
