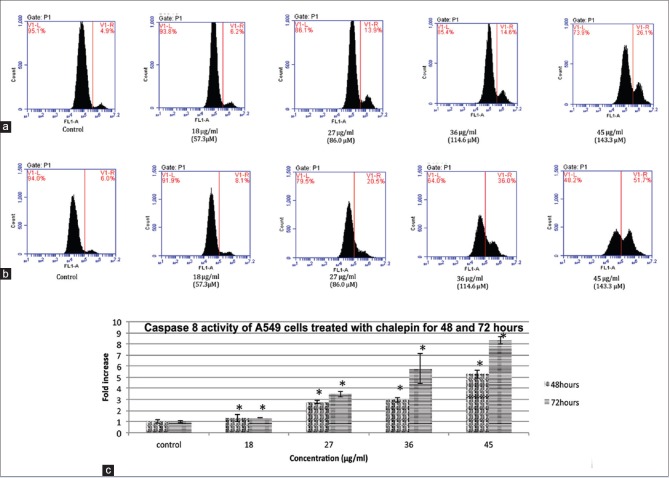
Figure 8.
Caspase 8 activity of A549 cells treated with chalepin and incubated for 48 h and 72 h. (a) Flow cytometric analysis of apoptotic (V1-R) and nonapoptotic populations (V1-L) for active caspase 9 activity at 48 h incubation (b) Flow cytometric analysis of apoptotic (V1-R) and nonapoptotic populations (V1-L) for active caspase 8 activities at 72 h incubation (c) Fold increase of A549 cells treated with chalepin at different incubation times. The data expressed as mean ± standard deviation of three replicates. Asterisks indicate significantly different value from control (*P < 0.05)

