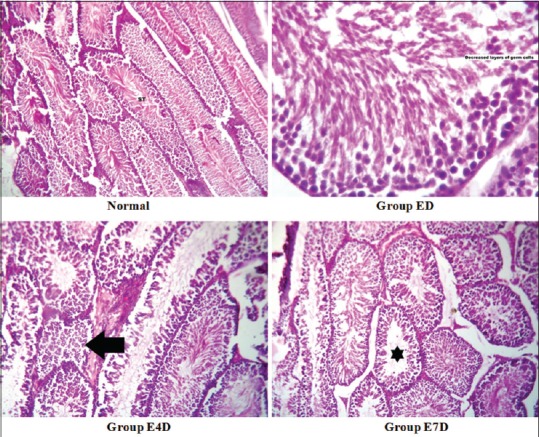
Figure 2.

Histopathological sections of testis after the treatment period Legend: Control: Seminiferous tubules showing normal spermatogenesis (H and E, ×100), ED: Seminiferous tubules showing decreased thickness of germ cells due to fewer spermatocytes (H and E, ×400), E4D: Many seminiferous tubules show normal spermatogenesis while some others show no mature spermatozoa (hypospermatogenesis – left arrow) (H and E, ×100), E7D: Most seminiferous tubules show normal spermatogenesis while very few show no mature spermatozoa (mild hypospermatogenesis - star) (H and E, ×100)
