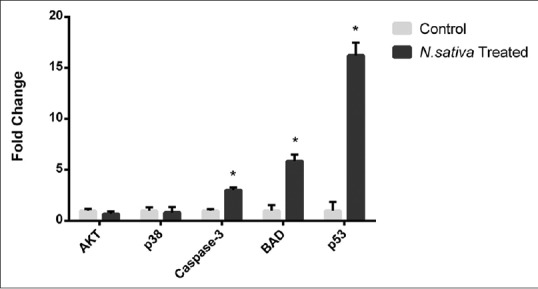
Figure 4.

Real-time polymerase chain reaction analysis of AKT, BAD, p38, CDC42, p53, and caspase-3 gene expressions upon Nigella sativa treatment in U937 cells. This bar graph representing the fold changes of gene expression quantified by normalization to the GAPDH (*P < 0.05)
