
Figure 3.
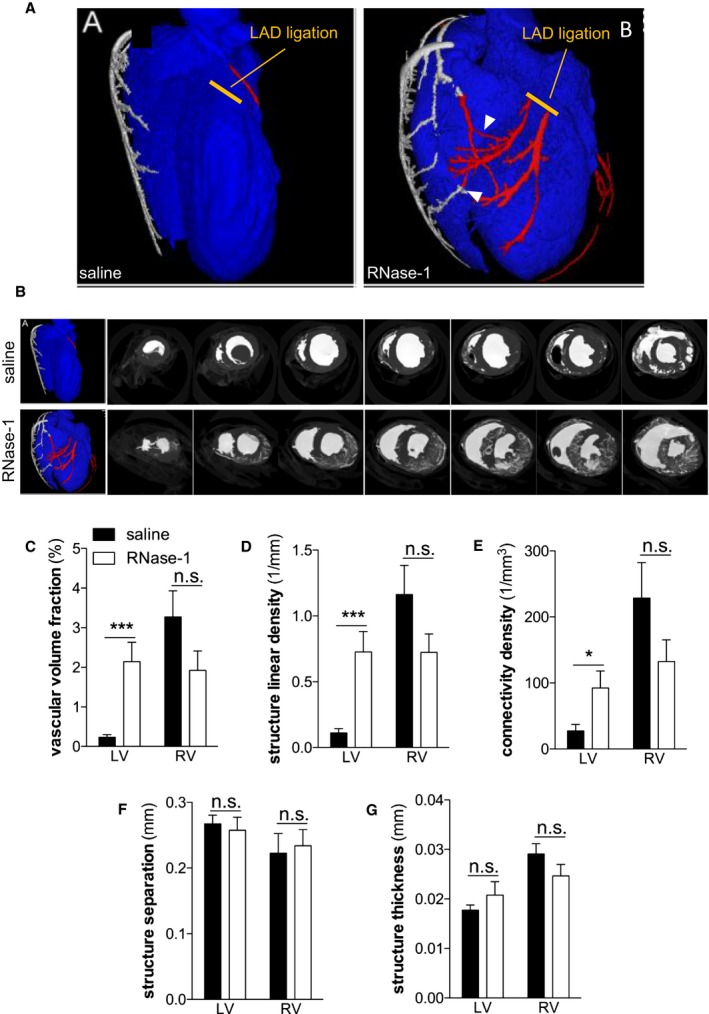
RNase‐1 application preserves coronary blood flow 24 hours after ligation of the LAD. A and B, Representative micro–computed tomography images of hearts 24 hours after ligation of the LAD and after treatment of the mice with saline (upper and left panels, respectively) or RNase‐1 (50 μg RNase‐1/kg; lower and right panels, respectively). Arrowheads indicate collateral connections. C, Density of contrast agent calculated in coronary arteries 24 hours after ligation of the LAD, indicating vascular volume structure. D, Structure linear density measured as the average amount of vessel diameters per area. E, Connectivity density of myocardial vessels. F, Structure separation measured as the average distance between vessels. G, Structure thickness measured as the average thickness of the vessel wall (*P<0.05, *** P<0.001, n=5). LAD indicates left anterior descending coronary artery; LV, left ventricle, n.s., not significant; RNase‐1, ribonuclease 1; RV, right ventricle.