
Figure 1.
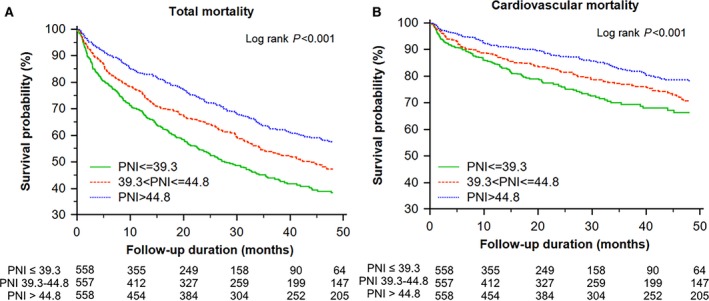
Kaplan–Meier survival curve analysis of total mortality (A) and cardiovascular mortality (B) across the tertiles of the prognostic nutritional index (PNI; >44.8, 44.8 to >39.3, and ≤39.3).
Official websites use .gov
A
.gov website belongs to an official
government organization in the United States.
Secure .gov websites use HTTPS
A lock (
) or https:// means you've safely
connected to the .gov website. Share sensitive
information only on official, secure websites.
Kaplan–Meier survival curve analysis of total mortality (A) and cardiovascular mortality (B) across the tertiles of the prognostic nutritional index (PNI; >44.8, 44.8 to >39.3, and ≤39.3).