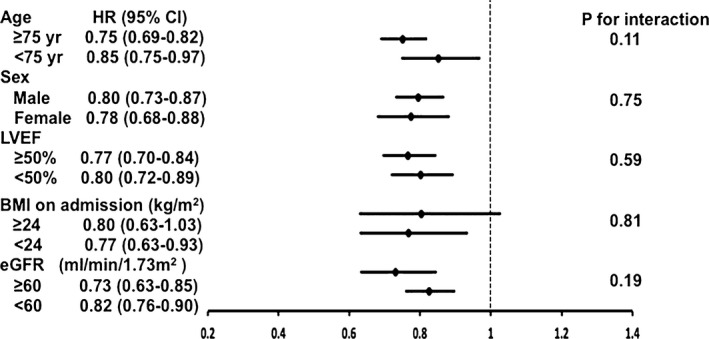
Figure 4.

Hazard ratio (HR) and 95% confidence interval (CI) per 1‐standard deviation increase of prognostic nutritional index (PNI) for mortality in subgroup analyses after accounting for age and sex. PNI has taken natural logarithm transformation in the analyses. BMI indicates body mass index; eGFR, estimated glomerular filtration rate; LVEF, left ventricular ejection fraction.
