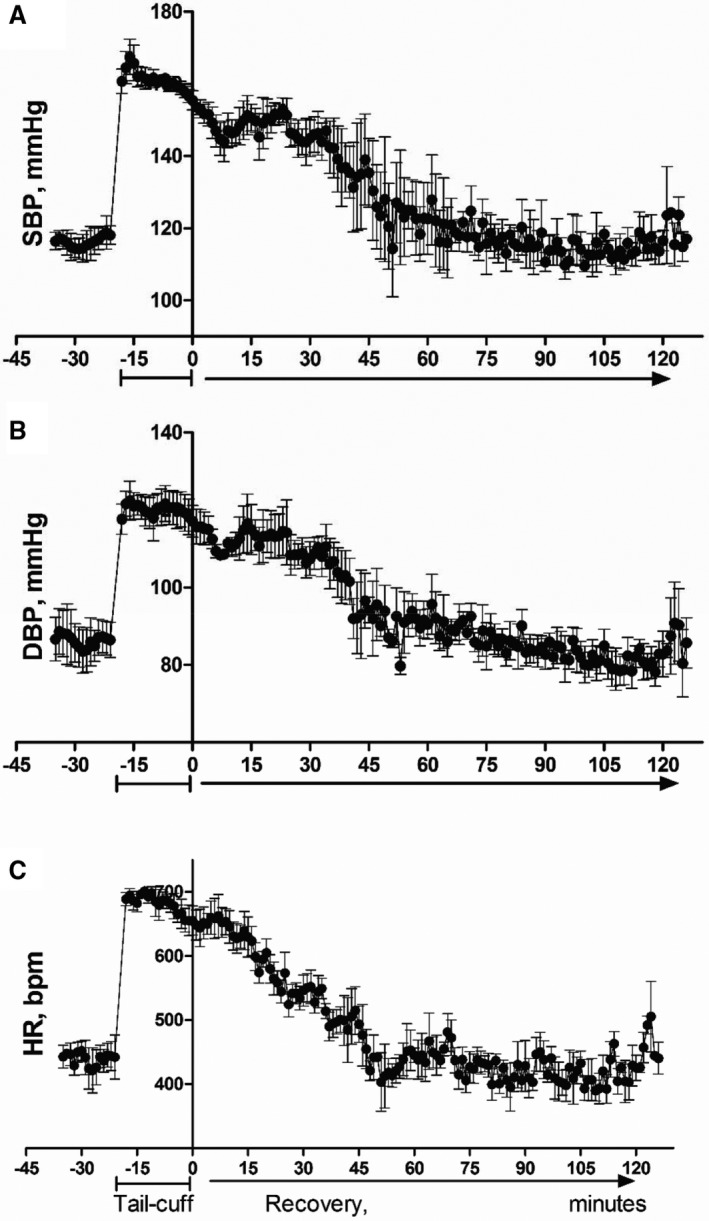
Figure 5.

Hemodynamic profile during and until 2 hours after the tail‐cuff recording. A, Systolic blood pressure. B, Diastolic blood pressure. C, Heart rate. Values are mean±SEM for 3 animals, each data point represents 1‐minute average for 3 animals. Mice are picked up at ≈−17‐minute time point as seen on the graph. The time point “0” represents the point when the animals are released back to home cage after tail‐cuff recording is complete.
