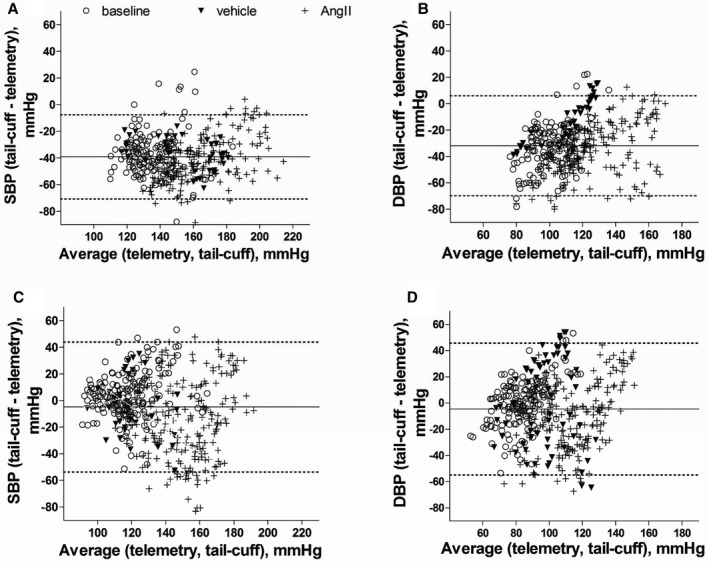
Figure 9.

Comparison of blood pressure recordings made by telemetry and the tail‐cuff technique in the same mouse: Bland‐Altman plot of simultaneous systolic (A), diastolic (B), and nonsimultaneous systolic (C) and diastolic (D) blood pressure recordings. Systolic blood pressure (SBP) or diastolic blood pressure (DBP), as measured simultaneously or nonsimultaneously by the 2 techniques at baseline (clear circles) and following angiotensin II (AngII) (crosses) or vehicle (filled triangles) infusion. Bias±limit of agreement (±2SD) for: (A) SBP: −37.2±16.9 (at baseline), −35.8±12.0 (vehicle), and −41.2±16.4 (AngII infusion). B, DBP −33.5±18.2 (baseline), 12.3±16.9 (vehicle), and 34.4±18.8 (AngII infusion). C and D, for (C) SBP, 2.63±17.1 (baseline), 0.93±36.2 (vehicle), −15.2±29.2 (AngII infusion); and (D) DBP, −0.68±20.4 (baseline), −2.09±26.75 (vehicle), and −11.2±25.1 (AngII infusion). Each data point represents 1 of (A and B) 399 pairs of simultaneous recordings by telemetry and tail‐cuff, of which: 141 pairs or measurement by the 2 techniques were made at baseline, 41 pairs following vehicle, and 216 pairs of measurements following AngII infusion; (C and D) 437 pairs of nonsimultaneous recordings pairs, of which: 161 pairs of recordings at baseline, following vehicle—54 pairs, or AngII infusion—222 pairs of data made by telemetry and tail‐cuff in 12 mice. The solid lines represent mean difference between telemetry and tail‐cuff systems (bias) and the dotted lines show upper and lower 95% confidence limits of agreement (2 SD) for combined baseline, vehicle, and AngII groups.
