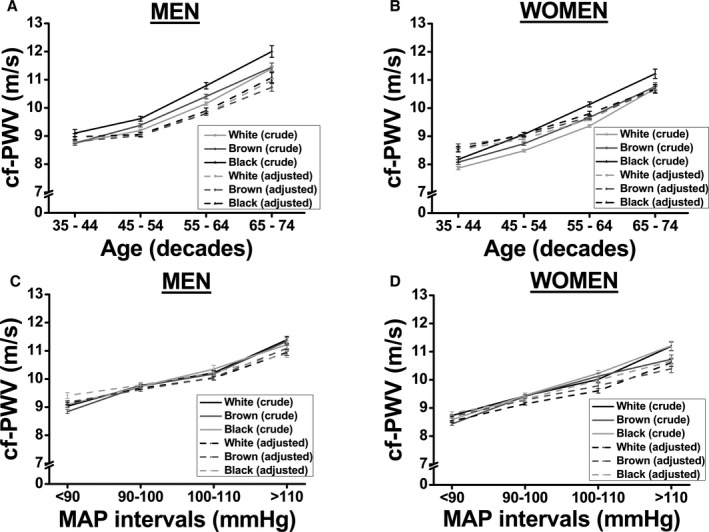
Figure 2.

Association between carotid‐femoral pulse wave velocity (cf‐PWV) and race based on progressive increases in age (A: men, and B: women) or mean arterial pressure (MAP; C: men, and D: women). A and B, Model was adjusted for MAP, waist circumference, heart rate, fasting glucose, and glomerular filtration rate. C and D, Model was adjusted for age, waist circumference, heart rate, fasting glucose, and glomerular filtration rate. Values are shown as mean±SEM.
