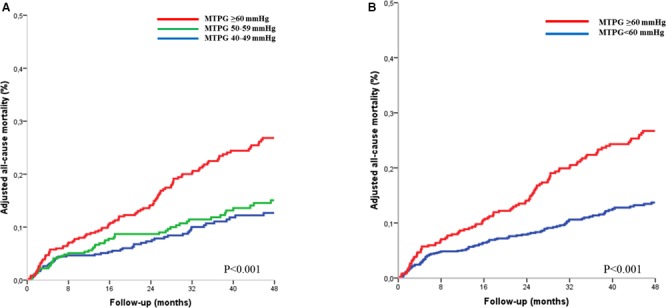
Figure 2.

Adjusted all‐cause mortality curves in the severe aortic stenosis population (n=1143) according to mean transaortic pressure gradient (MTPG), divided into 3 groups (MTPG 40–50 mm Hg, MTPG 50–59 mm Hg, and MTPG ≥60 mm Hg) (A) and into 2 groups (MTPG <60 mm Hg and MTPG ≥60 mm Hg) (B). Curves are adjusted for age, sex, body surface area, hypertension, New York Heart Association class, coronary artery disease, history of atrial fibrillation, comorbidity index, and left ventricular ejection fraction.
