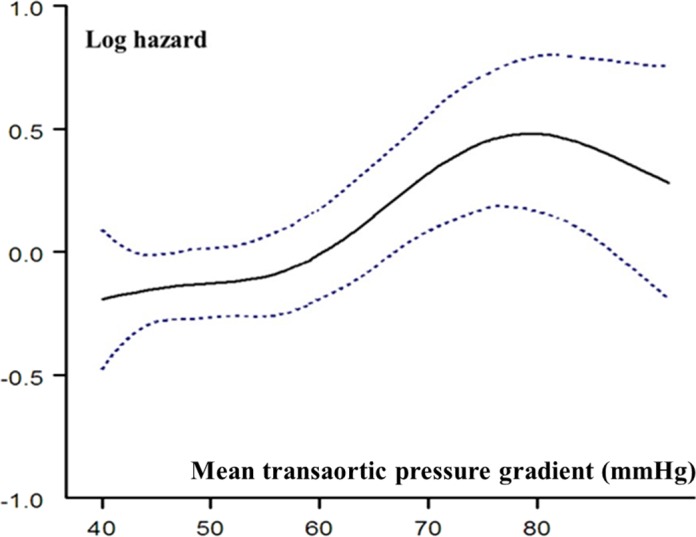
Figure 3.

Relationship between MTPG and risk of mortality during follow‐up. Hazard ratio (solid line) and 95% CIs are estimated in a Cox model with MTPG represented as a spline function and adjusted for age, sex, body surface area, hypertension, New York Heart Association class, coronary artery disease, history of atrial fibrillation, comorbidity index, and left ventricular ejection fraction.
