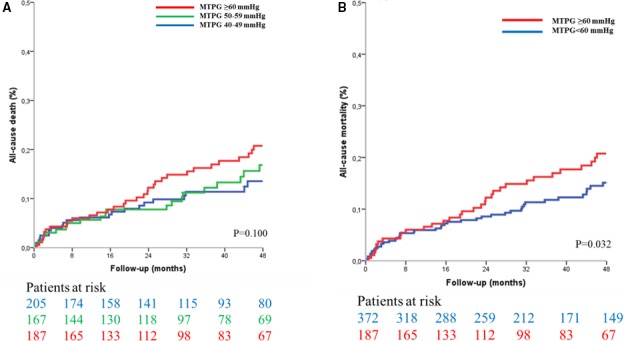
Figure 5.

Kaplan–Meier curves of survival in asymptomatic and minimally symptomatic patients with severe aortic stenosis (n=559) according to mean transaortic pressure gradient (MTPG). A, Dividing the population into 3 groups (MTPG 40–50 mm Hg, MTPG 50–59 mm Hg, and MTPG ≥60 mm Hg). B, Dividing the population into 2 groups (MTPG <60 mm Hg and MTPG ≥60 mm Hg).
