Figure 5.

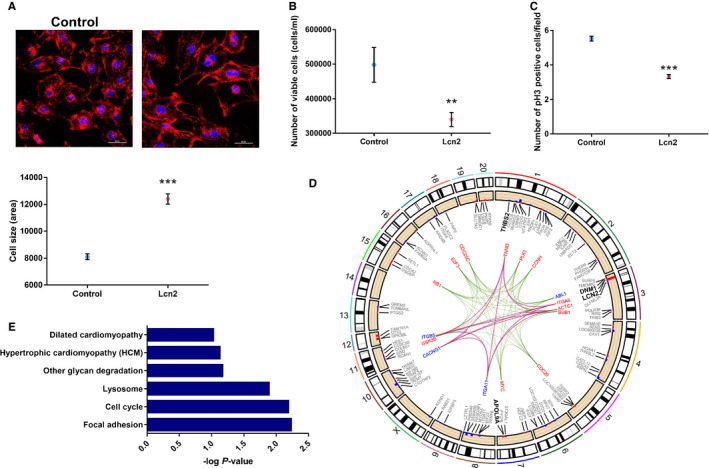
Role of lipocalin‐2 (Lcn2) in cardiac cells. A, Representation of wheat‐germ agglutinin (red) and DAPI (blue) staining, used to estimate cell size (×400 magnification; scale bar=60 μm). Overexpression of Lcn2 increased the size of the cells when compared with cells transfected with the empty plasmid (P<0.0001). B, Overexpression of Lcn2 reduced the number of cells measured by hemocytometer (P=0.0052). C, Overexpression of Lcn2 resulted in cell‐cycle arrest, observed by reduced phosphorylation of histone H3 (pH3; ×200 magnification; scale bar=100 μm; P<0.0001). D, Genes and pathways differentially regulated with overexpression of Lcn2. Cell cycle (Kyoto Encyclopedia of Genes and Genomes [KEGG] rno04110; P=0.006) is shown in green, hypertrophic cardiomyopathy (KEGG rno05410, P=0.07) in red, and dilated cardiomyopathy (KEGG rno05414; P=0.09) in blue. Genes of dilated cardiomyopathy and hypertrophic cardiomyopathy pathways were the same, and therefore lines overlapped. Each edge point indicates the chromosomal location for genes identified in specific pathways from the differentially expressed genes. Bar plots are the differentially expressed genes in each pathway. Red depicts genes upregulated, and blue those downregulated, represented as log2 fold change. E, Gene ontology analysis, showing −log P value. All experiments were run in 3 independent experiments, with at least 3 replicates each (total, 9 replicates). For experiments involving confocal microscopy, 10 different fields were analyzed per replicate. Positive controls were added to all experiments. **P<0.01; ***P<0.001. Data shown as mean and error bars represent SEM.
