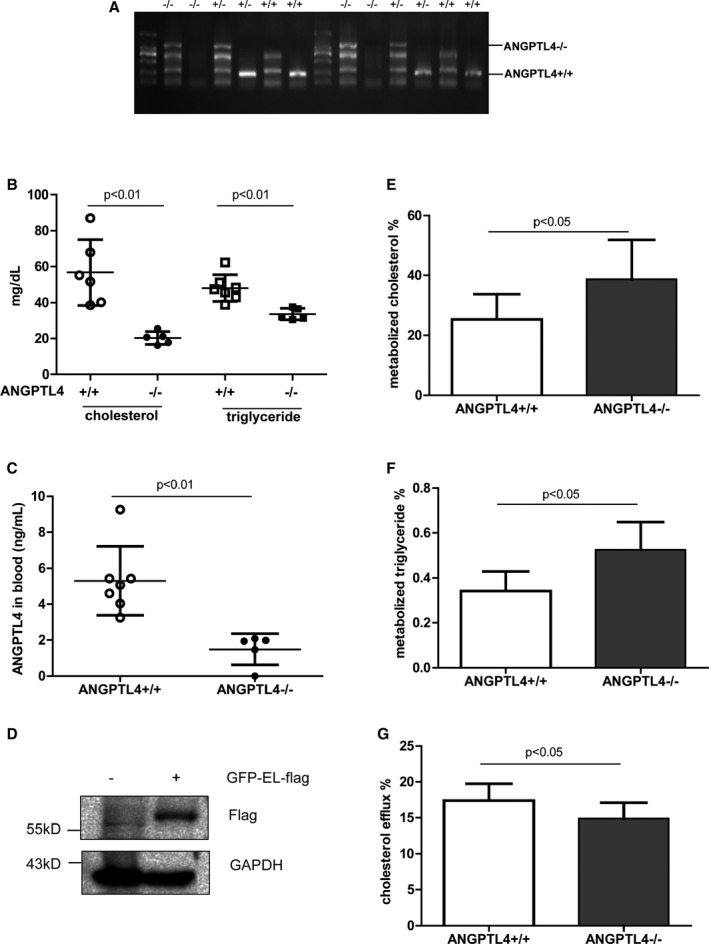
Figure 3.

ANGPTL4 as a HDL component for HDL metabolism and function in mice. A, Phenotype determination by RT‐PCR. Two pairs of primers were used to screen ANGPTL4−/− mice. B, Total cholesterol and triglyceride levels in the blood of ANGPTL4+/+ and ANGPTL4−/− mice. n=5 to 7. C, Plasma levels of ANGPTL4. n=5 to 7. The filled circles and squares represent ANGPTL4+/+ mice and the open circles denote ANGPTL4−/− mice. HDLs were isolated from ANGPTL4+/+ and ANGPTL4−/− mice and subjected at a final concentration of 100 μg/mL onto endothelial lipase (EL)‐expressing 293 cells for hydrolysis. Human EL expression in purified HEK 293 cells transfected with the plasmid containing human EL cDNA (D). The percentage of metabolized cholesterol is shown in (E) and the ratio between the amount of free fatty acids produced by EL lysis vs total amount of triglyceride input before EL lysis is shown in (F). n=6 to 7. G, The percentage of cholesterol efflux against plasma of ANGPTL4+/+ and ANGPTL4−/− mice. n=8 to 18. ANGPTL4 indicates angiopoietin‐like protein 4; HDL, high‐density lipoprotein; RT‐PCR, reverse transcription polymerase chain reaction.
