
Figure 4.
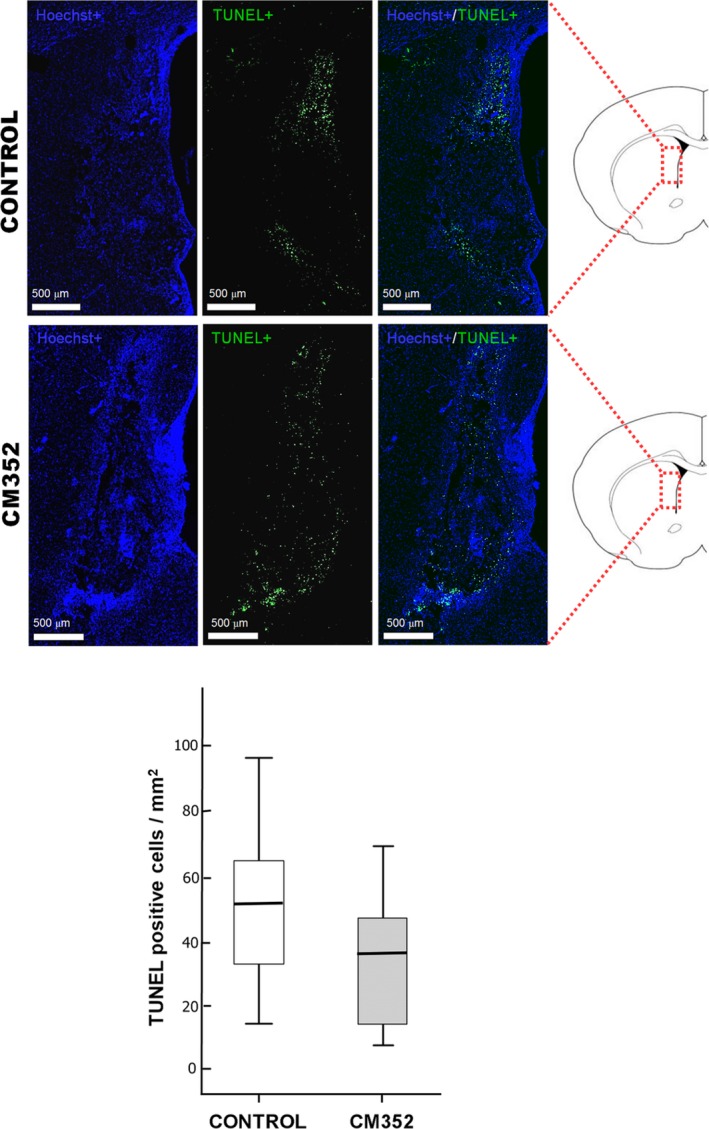
Analysis of apoptotic cells (TUNEL‐positive cells, in green) and nucleus (Hoechst marker, in blue) in brain samples of the control (n=3) and CM352‐treated rats (n=3) at 14 days after ICH. Apoptotic cell density in perihematomal area of the control and CM352 groups. Scale bars: 500 μm. Data are shown as median [interquartile range]. ICH indicates intracerebral hemorrhage; TUNEL, terminal deoxynucleotidyl transferase dUTP nick end labeling.