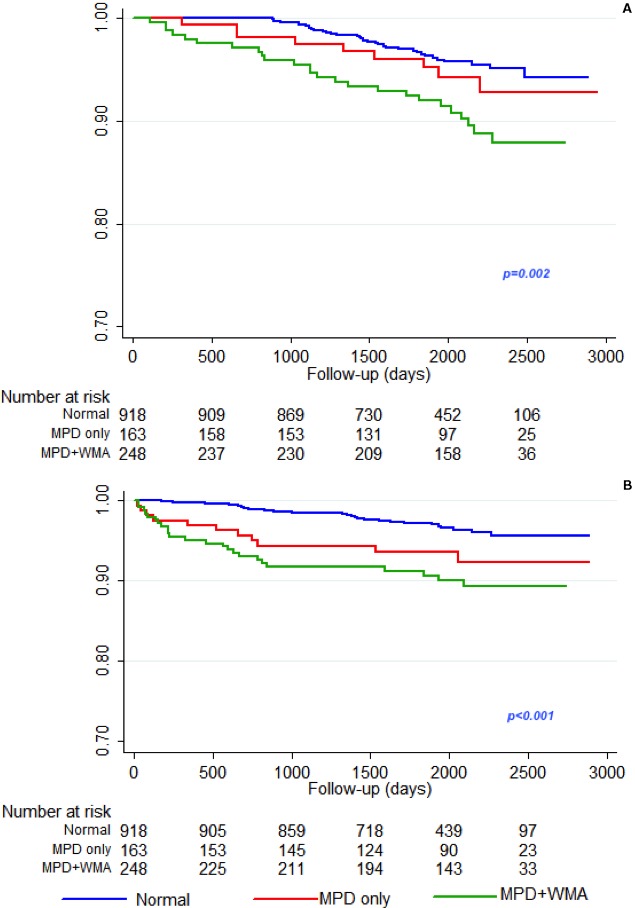
Figure 4.

Event‐free survival curves for single components of the primary end point, cardiac death (A) and nonfatal MI (B), based on results of contrast dipyridamole echocardiography, The overall difference among the curves is highly statistically significant (Log‐rank=0.002 for cardiac death and <0.001 for nonfatal myocardial infarction). MI indicates myocardial infarction; MPD, myocardial perfusion defect; WMA, wall motion abnormality.
