FIGURE 5.

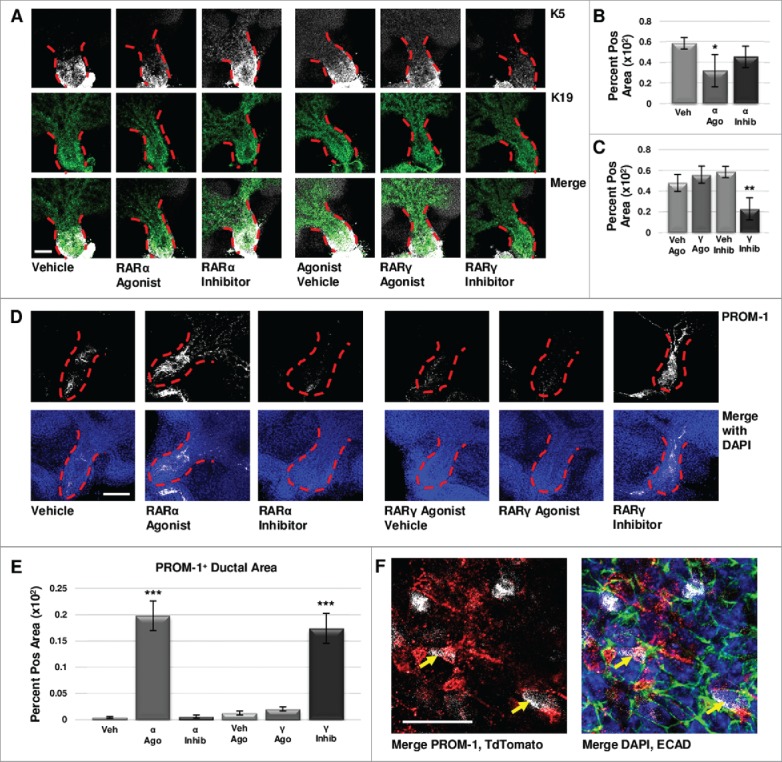
Retinoid Signaling Promotes Lumenizing Cell Differentiation. (A) E12.5 explants were cultured for 72 hours and immunostained for basal marker K5 and ductal marker K19. Scale bar, 100 μm. (B) Quantification of K19-positive area in the main duct with RARα agonist shows significantly decreased K19, correlating with decreased K5, while no significant change in K19 is observed with RARα inhibition. Veh n = 11, α ago n = 6, α inhib n = 5 explants. Statistical analysis completed using Student's two-tailed t-test. *p = 0.02. (C) Quantification of K19-positive area in the main duct with RARγ agonist treatment indicates no significant change in K19, similar to RARα inhibition. With RARγ inhibition, K19 levels are significantly decreased corresponding to decreased K5. Ago veh n = 12, γ ago n = 9, veh inhib n = 11, γ inhib n = 5 explants. Statistical analysis completed using Student's two-tailed t-test. **p = 0.005. This data indicates that loss of K5 does not correspond with a gain of K19. (D) E12.5 explants cultured for 72 hours show increased expression of PROM-1 with RARα agonism and RARγ inhibition under conditions that show significantly decreased K5. Increased PROM-1 is not observed with RARα inhibition or RARγ agonism where K5 was increased. Scale bar, 100 μm. (E) Quantification of PROM-1 positive area in the main duct of the gland in cultures at both 72 hours and 96 hours (data not shown) indicates a significant increase in PROM-1 positive area with RARα agonist or RARγ inhibitor as compared to control. Veh n = 11, α ago n = 17, α inhib n = 10, ago veh n = 10, γ ago n = 10, veh inhib n = 15, γ inhib n = 15 explants. Statistical analysis completed using Student's two-tailed t-test. ***p < 0.0001. This data indicates RAR isoform-mediated decreases in K5 result in increased PROM-1 expression. (F) Lineage tracking using E12.5 K5- CreERT2;ROSA26-TdTomato mice cultured ex vivo for 68 hours following a four hour tamoxifen induction (1 μM) shows TdTomato reporter expression (white) in a handful of PROM-1 (red) positive cells in the main duct (yellow arrows), with ECAD (green) and DAPI (blue), indicating that these cells were derived from the K5 lineage. Scale bar, 50 μm.
